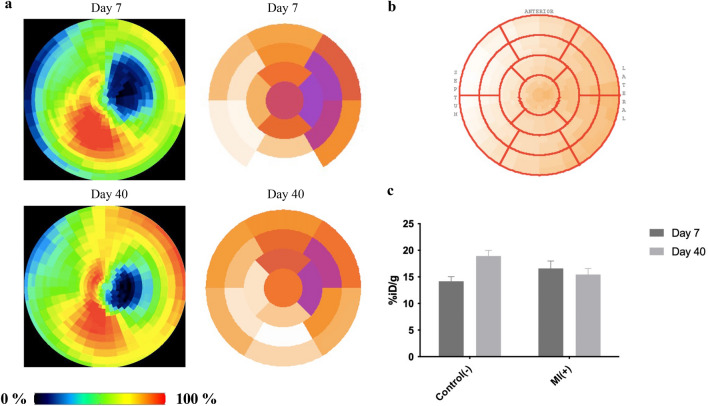
Figure 4.
Metabolic heart activity (viability) measured through glucose uptake. (a) Conversion of PET images to maps of radiotracer activity in the heart (left) and their counterparts presented as polar maps for MI( +) mice (right). A reduction in the metabolically inactive zone can be seen in the walls and apex segments. (b) Scheme of the polar map by 17 AHA segmentation with indication of septum, anterior and lateral directions. (c) Graph for dual cardiac viability PET imaging in control(−) and MI( +).

