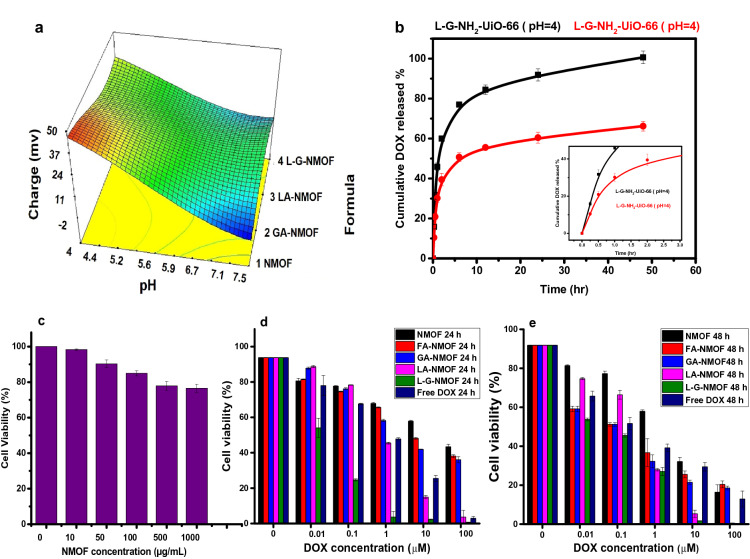
Figure 5.
(a) chart showing the effect of pH change on the zeta potential values of developed NMOFs formulas, (b) In-vitro drug release from LA-GA-NMOF at different pHs (4 and 7.4) with a focus on the release profile during the first 3 h (inset), (c) cytocompatibility study using HSF cells post-treatment with different concentrations of pristine NMOF for 72 h. (d, e) HepG2 cell viabilities post-incubation with free DOX and DOX-loaded NMOFs for 24 h (d) and 48 h (e).

