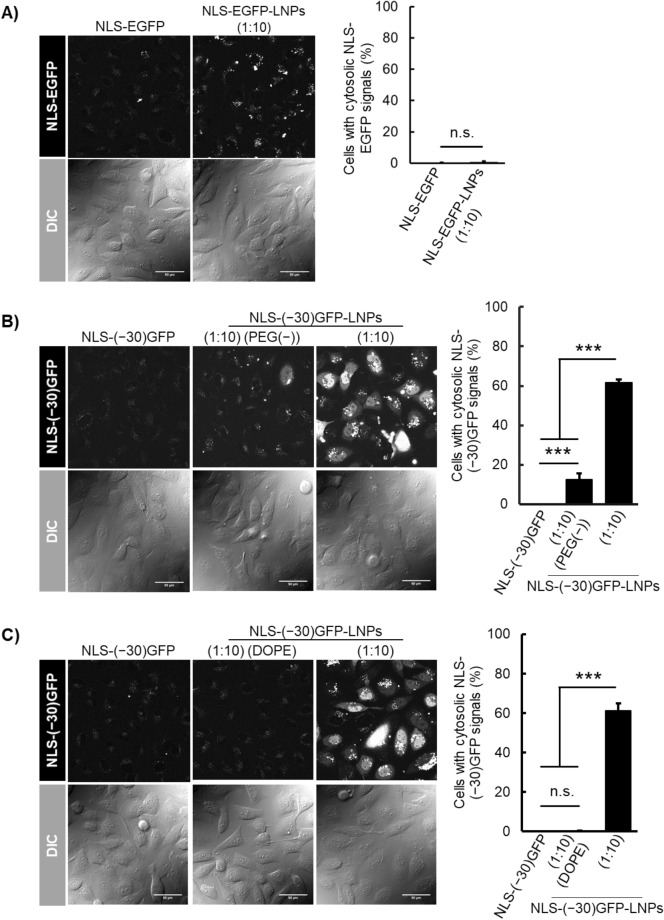
Figure 4.
CLSM of cells treated with protein-encapsulating LNPs and the percentages of cells having cytosolic/nuclear localization of the proteins 6 h after treatment with the following: (A) NLS-EGFP alone (left) and NLS-EGFP-LNPs (1:10) (right); (B) NLS-(− 30)GFP alone (left), NLS-(− 30)GFP-LNPs (1:10) (PEG(–)) (center), and NLS-(–30)GFP-LNPs (right); (C) NLS-(− 30)GFP-LNPs (1:10) (DOPE) (center), and NLS-(–30)GFP-LNPs). The percentages of cells bearing cytosolic NLS-EGFP/NLS-(− 30)GFP signals are presented as the mean ± SD (n = 3). n.s., not significant; ***P < 0.001 (one-way analysis of variance (ANOVA) followed by Tukey–Kramer’s honestly-significant difference test). Protein concentration, 2.5 µM. Concentration of LNPs were set to yield 2.5 µM NLS-EGFP or NLS-(− 30)GFP when hypothesized that all the employed proteins for LNP preparation was encapsulated into the LNPs.

