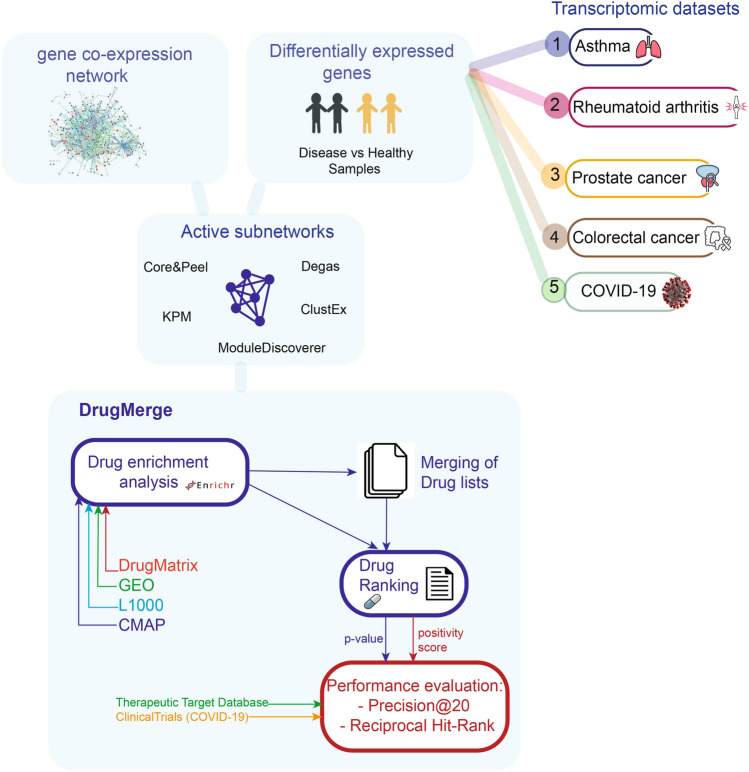
Figure 1.
Overview of the workflow. The first part of the figure shows how we generated the data inputs of DrugMerge. These data have been created in Lucchetta et al.4, and we reported them here for sake of completeness. We used several transcriptomic data to identify differentially expressed genes and the gene co-expression network to find one active subnetwork for each method used (Core&Peel, ModuleDiscoverer, Degas, ClustEx, and KeyPathwayMiner). For each of them, we performed the drug enrichment analysis on four drug perturbation databases: DrugMatrix, GEO, L1000, and CMAP. After that, we ranked the drugs according to the p-value or the positivity score. We also merged more drug lists, which come from different algorithms for the same disease and we applied the same ranking strategy. Finally, we evaluated the DrugMerge performance through the Precison@20 and the Reciprocal Hit-Rank using the golden-standard drugs, collected in the Therapeutic Target Database, and ClinicalTrials for COVID-19. The image has been created using Adobe Illustrator.

