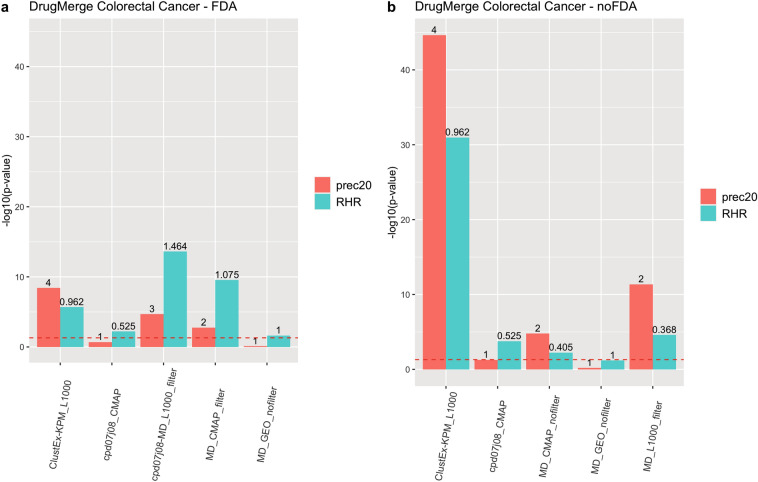
Figure 2.
DrugMerge performance on colorectal cancer data. The bars represent the with respect to the precision@20 (red), and the RHR (light blu). On the x-axis, different algorithms or combinations of them are shown. The numbers on the top of the bars show the absolute values of precision@20 or RHR. The dotted red line represents the limit of significance (). All the bars above the line show a significant p-value. The (a) panel represents the DrugMerge performance when only FDA-approved drugs are considered; (b) when all drugs (without any FDA filtering) are considered. The plot has been generated by the ggplot281 R package.

