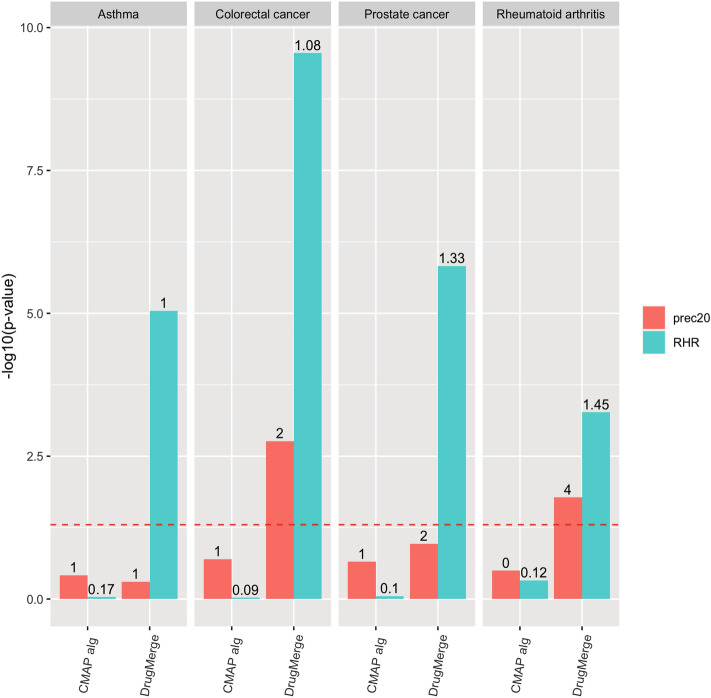
Figure 4.
Comparison of performance of DrugMerge and the CMAP algorithm across the four benchmark diseases. For Colorectal Cancer and Prostate Cancer both methods use CMAP data. For Asthma and Rheumatoid Artrithis DrugMerge uses GEO data. The bars represent the with respect to the precision@20 (red), and the RHR (light blu). The numbers on the top of the bars show the absolute values of precision@20 or RHR. The dotted red line represents the limit of significance (). All the bars above the dotted line show a significant p-value. The plot has been generated by the ggplot281 R package.

