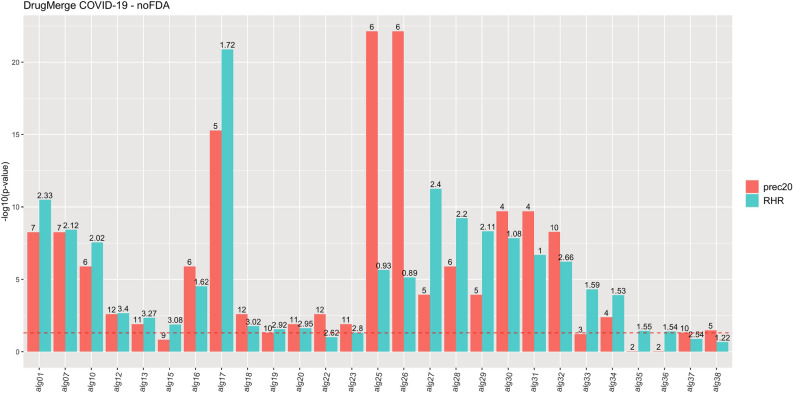
Figure 6.
DrugMerge performance on COVID-19 data without FDA approval restriction. The bars represent the with respect to the precision@20 (red), and the RHR (light blu). On the x-axis, different algorithms or combinations of them are indexed with aliases, since the complete algorithm names are too long. The mapping between them is on Table S9. The numbers on the top of the bars show the absolute values of precision@20 or RHR. The dotted red line represents the limit of significance (). All the bars above the dotted line show a significant p-value. The plot has been generated by the ggplot281 R package.

