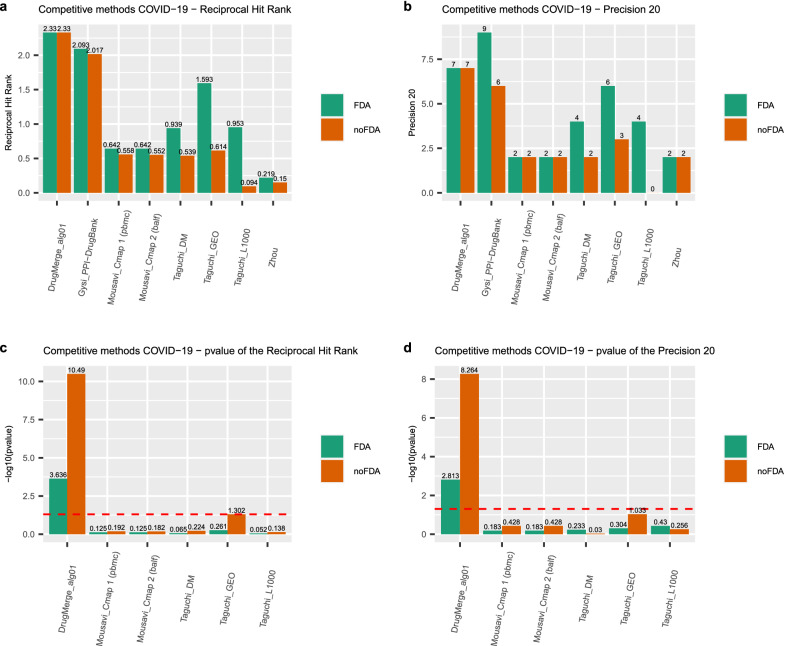
Figure 7.
Performance of drug rankings reported in literature for COVID-19 drug repurposing. The (a,b) panels show the absolute values of RHR and precision 20, respectively. The (c,d) show the of the RHR and precision 20, respectively. The dotted red line indicates the 0.05 significance threshold. The analyses have been performed using only FDA-approved drugs (green bars) and without any FDA filtering (red bars). The plot has been generated by the ggplot281 R package.

