

Abstract
Pharmacophore modelling studies have been performed for a series of 2,4-disubstituted-pyrimidines derivatives as EGFR L858R/T790M tyrosine kinase inhibitors. The high scoring AARR.15 hypothesis was selected as the best pharmacophore model with the highest survival score of 3.436 having two hydrogen bond acceptors and two aromatic ring features. Pharmacophore-based virtual screening followed by structure-based yielded the six molecules (ZINC17013227, ZINC17013215, ZINC9573324, ZINC9573445, ZINC24023331 and ZINC17013503) from the ZINC database with significant in silico predicted activity and strong binding affinity towords the EGFR L858R/T790M tyrosine kinase. In silico toxicity and cytochrome profiling indicates that all the 06 virtually screened compounds were substrate/inhibitors of the CYP-3A4 metabolizing enzyme and were non-carcinogenic and devoid of Ames mutagenesis. Density functional theory (DFT) and molecular dynamic (MD) simulation further validated the obtained hits.
Supplementary Information
The online version contains supplementary material available at 10.1007/s40203-021-00113-x.
Keywords: 2,4-disubstituted-pyrimidines; Pharmacophore; Molecular docking; Virtual screening; MMGBSA; Molecular dynamic simulation
Introduction
Non-small cell lung cancer (NSCLC) is the most common lung cancer globally, with less than 20% of 5-year survival after diagnosis (Molina et al. 2008). The epidermal growth factor receptor (EGFR) belongs to the protein kinase family, a clinically established NSCLC treatment target, implicated in various cell signalling cascades that are critical for cell growth, proliferation, survival, and migration (Vansteenkiste and Schildermans 2005; Hirsch et al. 2003; Ohsaki et al. 2000; Sharma et al. 2007). In NSCLC, EGFR mutations primarily induce overexpression of EGFR or ‘Classic Mutation’ of exon 19 deletions (delE746-A750) and L858R substitutions in exon21 frame, contributing for 90% of activating mutations (Kawahara et al. 2010). FDA approved first-generation tyrosine kinase inhibitors (TKI) were gefitinib (2009) and erlotinib (2013) for the EGFR activating mutation in positive NSCLC patients (Cohen et al. 2003; Bonomi 2003). However, a single point acquired drug resistance of threonine790-to-methionine790 (T790M) is often found in around 50% of patients with EGFR alteration, significantly restricting the effectiveness of these medications in clinical usage (Kobayashi et al. 2005; Shaikh et al. 2021; Engelman and Jänne 2008; Pao et al. 2005). To resolve the resistance induced by the T790M, second-generation EGFR-TK inhibitors (afatinib and dacomitinib) were developed with an electrophilic Michael acceptor head, capable of covalently alkylating the cysteine 797 residue (Cys797) near the EGFR ATP binding site (Yun et al. 2008; Patel et al. 2017). However, their clinical effectiveness has so far been limited due to skin rash and gastrointestinal toxicity because of the lack of selectivity between WT EGFR and mutant EGFR (Patel et al. 2017; Kim et al. 2012).
Third-generation EGFR TKIs were therefore developed (e.g. WZ4002, rociletinib/CO-1686, Osimertinib/AZD9291, olmutinib/HM61713, etc.), which covalently bind to Cys797 with greater selectivity towards the T790M mutation as compared to the WT EGFR (Patel et al. 2017; Song et al. 2016; Chen et al. 2017). The first recorded third-generation EGFR-TKI, with 30−100 times more potency against EGFR L858R/T790M than to WT EGFR was WZ4002 (Zhou et al. 2009). Osimertinib has similar amino-pyrimidine scaffold to WZ4002. USFDA issued accelerated approval to Osimertinib in 2015 and full approval in March 2017 for the treatment of patients with EGFR-T790M mutations and whose disease has advanced in the first and second generation of EGFR-TKI therapy (Jänne et al. 2015; Goss et al. 2016; https://www.drugs.com/history/tagrisso.html). It has almost 200 times higher occupancy towards L858R/T790M than the WT-type EGFR, confirming its specificity for the mutant EGFR (Song et al. 2016; Chen et al. 2017; Lu et al. 2018). However, C797S mutation to Osimertinib has recently been identified, suggesting the need to find a new drug molecule to resolve T790M/C797S mutation problem (Thress et al. 2015; Chabon et al. 2016). In context to the above-mentioned facts and in continuation of our research on EGFR-TKIs (Patel et al. 2018a, 2020a, b), the current article deals with identifying the new L858R/T790M EGFR TK inhibitor based on the pharmacophore and structural based virtual screening approaches.
Methodology
Computational details
All computational work was performed on Schrodinger, LLC, New York, USA, 2008. LigPrep, PHASE, Glide, Protein Preparation Wizard QikProp, Desmond 3.1 used for pharmacophore hypothesis, docking study, ADME study and molecular dynamics simulation study (Chaudhari and Bari 2016; Kausar and Falcao 2018). The crystal structures of T790M mutant EGFR PDB ID: 2JIU (https://www.rcsb.org/structure/2JIU) and WT EGFR PDB ID: 4ZAU were retrieved from RCSB Protein Data Bank (PDB) (https://www.rcsb.org/structure/4ZAU).
Dataset
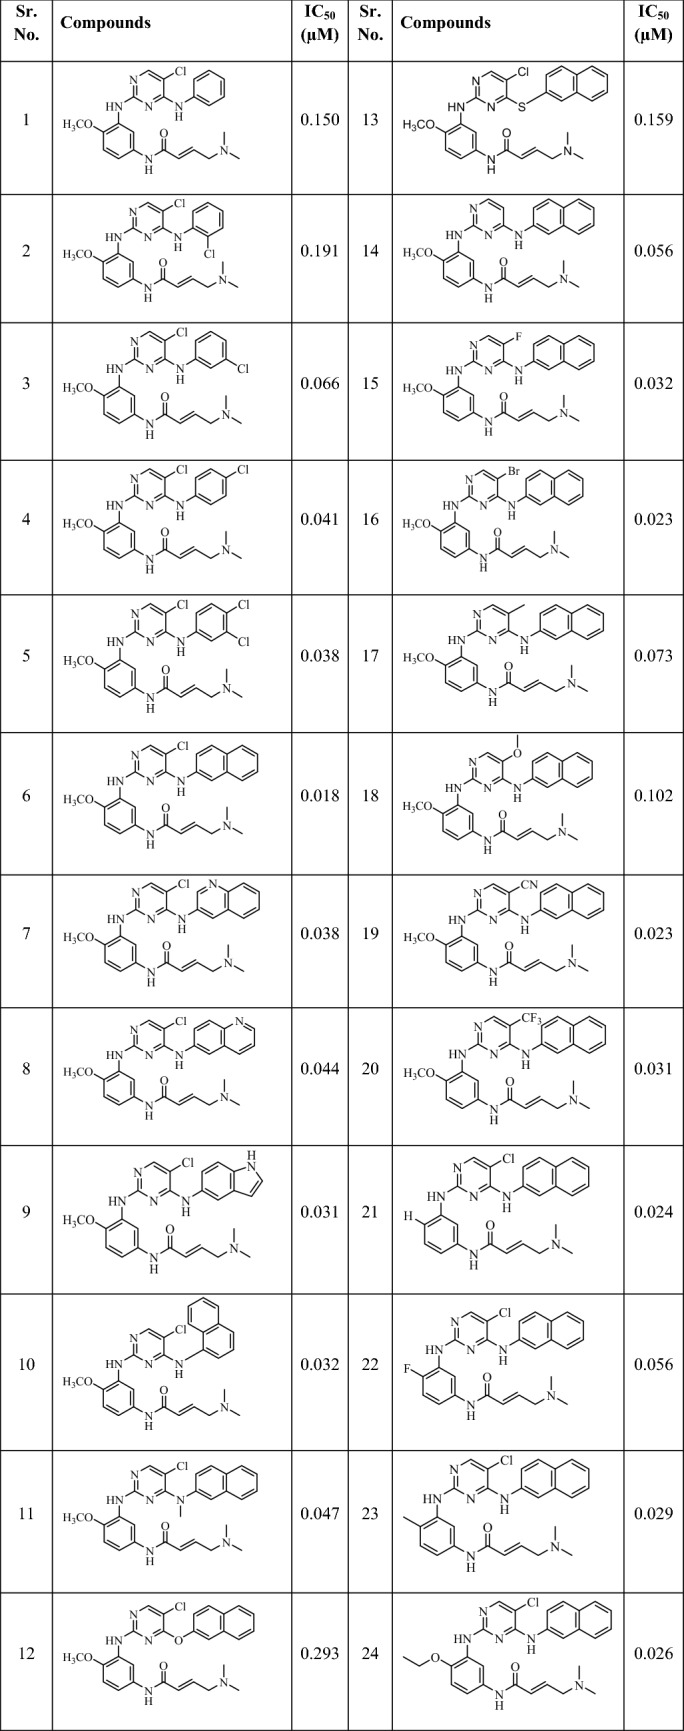
Twenty-four derivatives of 2,4-substituted-pyrimidines previously reported as L858R/T790M EGFR-TK inhibitors were taken for generation of pharmacophore (Chan et al. 2015). These selected compounds shared the same assay procedure with significant variations in their structures and potency profiles. The inhibitory activity of the compounds reported as IC50 values were considered for the whole process (Table 1) (Choubey and Jeyaraman 2016; Noolvi and Patel 2013).
Table 1.
2,4-disubstituted-pyrimidines along with their EGFR L858R/T790M inhibition used for pharmacophore development
Ligand preparation
For the development of an accurate pharmacophore model, a 3D structure is necessary. The 3D ligand structures were built using Maestro’s builder panel and optimized with the LigPrep module (version 2.2, Schrodinger, LLC, New York, USA, 2008). LigPrep was carried out to desalt and to generate all possible tautomers and pH 7.0 states with Epik. Ligands were minimized with OPLS 2005 by retaining chiralities (Tawari et al. 2008; Wang et al. 2015; Dong and Zheng 2008; Golbraikh et al. 2003; Patel et al. 2018c).
Pharmacophore modelling
Virtual screening is a very useful application when it comes to identifying hit molecules as a beginning for medicinal chemistry (Patel et al. 2018b). Pharmacophore mapping and 3D QSAR screening are useful tool for the ligand based virtual screening. Phase module of Schrodinger is very useful module for the development and validation of Pharmacophore and 3D QSAR model (Dixon et al. 2006a, b). 3D pharmacophore modelling study was carried out using the optimized structures. In the current analysis, we have used PHASE (v3.0) for the shape screening and alignment of the L858R/T790M EGFR inhibitors. PHASE recognizes the three-dimensional arrangement of functional groups that are prevalent and essential for the biological activity of the ligands. The PHASE system also offers an integrated set of six pharmacophore properties that include hydrogen bond donor (D), hydrogen bond acceptor (A), hydrophobic group (H), positively ionizable group (P), negatively charged group (N) and aromatic ring (R) (Dixon et al. 2006a, b). Using a set of pharmacophore features, the pharmacophore model was developed to generate sites for all the compounds (Singh et al. 2011). To recognize common pharmacophore hypotheses, an active analogue approach was used (Sharma et al. 2016). Common pharmacophores were derived from active ligands’ conformations utilizing a tree-based partitioning strategy, which grouped similar pharmacophores based on inter-site distances (Pan et al. 2013). A series of the chemical structure has described the prominent pharmacophoric features. The allocated structural patterns are defined as SMARTS queries that enable the physical features of the site to reflect one of three potential geometric points, vector and group points (Chekkara et al. 2017). Common pharmacophoric hypothesis (CPHs) were verified using a score function to achieve the best alignment of active ligands employing a RMSD value of 1.2 Å with the default distance tolerance. The main components of an algorithm are the alignment of site points and vectors, relative conformational energy, volume overlap, selectivity, number of ligands matched and activity.
The alignment quality is calculated using three parameters: the alignment score, the vector score and the volume score. Following Eq. (1) has been used for survival score calculation.
| 1 |
where W = weights and S = scores, Ssite = alignment score; Svec = vector score Svol = volume score and Ssel = selectivity score. Wsite, Wvec, Wvol, and Wrew have default values of 1.0, while Wsel has a default value of 0.0. In hypothesis generation, default values have been used. Wm rew represents reward weights defined by m-1, where m is the number of actives that match the hypothesis (Prabhu et al. 2014). The PHASE-identified hypothesis was graded according to how the active ligands superimpose on different features of the hypothesis(Kandakatla et al. 2014). There are two options for 3D molecule alignments in PHASE: atom-based alignment and the pharmacophore-based alignment. In the current analysis, the atom-based alignment is used for the development of pharmacophoric model (Fig. 1).
Fig. 1.

Stages in pharmacophore generation and screening of the molecules
Molecular docking
The protein crystal structure of the mutant L858R/T790M EGFR-TK (PDB ID: 2JIU) and WT EGFR-TK (PDB ID: 4ZAU) were retrieved from the protein data bank. The preparation of the protein was carried out with the Protein Preparation Wizard in Maestro (Bhadoriya et al. 2015; Teli and Rajanikant 2012; Ugale et al. 2017; Tropsha et al. 2003; Golbraikh and Tropsha 2002). After verifying chemical correctness, the protein was prepared, assigning bond orders, eliminating water molecules, and adding hydrogens for pH 7.0 using Epik (Mysinger et al. 2012; http://dude.docking.org/targets/egfr; Jafari et al. 2018; Khadikar et al. 2001; Verma et al. 2019; Shen et al. 2004). To complete missing side chains and loops, Prime was used, and termini were capped. The protein structure was minimized by OPLS 2005 force field and default constraint of 0.30 Å RMSD (Khan et al. 2019; Roy et al. 2015; Ugale and Bari 2016; Sastry et al. 2013; Kumar and Elizabeth Sobhia 2012; Elokely and Doerksen 2013). The binding site was defined around the co-crystallized ligand, and the receptor grid was prepared. Molecular docking was accomplished in SP (Standard Precision) mode using the Glide ligand docking module (Patel et al. 2020b, c).
Lipinski’s rule for drug likeliness and in silico ADME prediction
The primary concern about the failure of drug candidates in clinical trials is poor pharmacokinetics (Kennedy 1997). The integration of ideal ADME properties in early stages will produce the best candidates to prevent subsequent attrition and efficiently pass-through clinical trials. With this objective, the drug likeliness of the compounds was further predicted by analyzing the pharmacokinetic profile of compounds using the Qikprop module (QikProp 2010). The QikProp v4.3 module uses the Jorgensen method for the estimation of pharmacokinetic properties. Physically important descriptors and pharmaceutically significant properties of all test compounds, such as molecular weight, H-bond donors, logp and H-bond acceptors, were analyzed per Lipinski’s rule of five. Lipinski’s Five rule is a thumb rule for evaluating drug-likeness, or deciding whether a chemical compound with specific pharmacological or biological activities possesses properties that would make it orally active drug (Lipinski et al. 1997; Benet et al. 2016; Doak and Kihlberg 2017).
Sites of metabolism (SOM) prediction using SMARTCyp
SOM of the virtual hits was predicted by SMARTCyp software developed by Patrik Rydberg and Lars Olsen (Rydberg et al. 2010, 2013). SMARTCyp predicts the sites in a molecule that are labile for metabolism by Cytochromes. The SMARTCyp tool accepts molecules in MOL, SDF or smiles format and assesses the SOM by detecting the two (dimensional (2D) molecule motifs) and P450 isoform 3A4 mediated metabolic sites. This tool evaluates the oxidation states of aliphatic carbons and aromatic sites by applying density functional theory (Rydberg et al. 2013). SMARTCyp is freely available from the internet at https://smartcyp.sund.ku.dk/mol_to_som.
Binding free energy calculation using prime MMGBSA approach
Using the default settings of the Prime MM-GBSA modules implemented in the Schrödinger program, binding free energies (ΔG Bind) of selected protein–ligand complexes were calculated by MM-GBSA approach. Glide pose viewer file was used for the Prime MM-GBSA analysis. To determine the relative binding affinity of ligands to the receptor, the MM-GBSA calculations are used. Since the MM-GBSA binding energies are estimated to be free binding energies, the more negative value indicates stronger binding affinity (Lyne et al. 2006; Chen et al. 2016; Ahmad et al. 2020).
The binding free energies for the protein–ligand complex is given by
| 2 |
EMM is the molecular mechanics energy; GSB is the surface generalized born solvation model for polar solvation, and GNP is the solvation term for the non-polar part.
Molecular dynamic simulation
Molecular dynamics (MD) simulations were performed using the Desmond software, an explicit solvent MD program and OPLS 2005 force field, for the top dock protein–ligand complex (Chow et al. 2008; Bowers et al. 2006; Raghu et al. 2014; Shivakumar et al. 2010). The protein–ligand complex was prepared in the protein preparation wizard with the predefined SPC (simple point charge) water model and an orthorhombic box shape. Sodium chloride with a physiological concentration of approximately 0.15 M was put between the protein atoms and the simulation box to set the ionic strength in 10 Å buffer regions (Deniz et al. 2016; Evans and Holian 1985). Minimization tasks have been carried out to relax the system to a local energy minimization; afterwards, this model system was submitted to 200 ns MD simulation steps using the OPLS_2005 force field. Noose-Hover chain thermostat algorithm at 300 K, Coulombic cutoff at 0.9 nm, Martyna-Tobias-Klein barostat algorithm at 1.01325 bar were employed for the MD simulation. The rest of the parameters were default (Rydberg et al. 2013; Lyne et al. 2006; Chen et al. 2016; Ahmad et al. 2020; Chow et al. 2008; Bowers et al. 2006; Raghu et al. 2014; Shivakumar et al. 2010; Deniz et al. 2016; Evans and Holian 1985; Cho et al. 1993; Patel et al. 2018d; Shinoda and Mikami 2003). The trajectories of MD simulations evaluated for ligand-receptor interactions were identified using the simulation interaction diagram (SID).
Density functional theory (DFT) calculations
It is essential to determine the structural behaviour of the active compound after the completion of the ligand-based and structure-based virtual screening and to explore how structural orientation biologically influences, and what parameters can affect the molecule’s biological activity. For this reason, single-point energy calculations using DFT were performed to explore the detailed facets in terms of structure, electronics, and energy states of every atom of compound. Virtually screened compounds were imported into the Jaguar platform in Schrodinger to compute the highest occupied molecular orbital (HOMO) and lowest unoccupied molecular orbital (LUMO) by using Lee–Yang–Parr correlation functional theory (B3LYP), incorporation of basis set 6-31G* level and hybrid DFT with Beckes 3-parameter exchange potential (Bochevarov et al. 2013; Panwar and Singh 2020; Jordaan et al. 2020). These factors play a significant role in explaining the magnitude of compounds interaction in the binding pocket of EGFR-TK.
Results and discussion
Zinc database mining
In an attempt to identify new hits that could potentially inhibit EGFR L858R/T790M, the Zinc database was mined using the query scaffold of 2,4-diminopyrimidine (basic ring of Osimertinib). The Osimertinib is the only drug approved by the FDA for the treatment of EGFR L858/T790M mutation that contains a 2,4-diminopyrimidine scaffold, and to identify molecules with similar structures, we have set the Tanimito coefficient of > 80% to mine the Zinc database that results in 98 compounds (Fig. 2a–e).
Fig. 2.


a Zinc database mining using 2,4-diamino pyrimidine as query scaffold. b Zinc database mining using 2,4-diamino pyrimidine as query scaffold. c Zinc database mining using 2,4-diamino pyrimidine as query scaffold. d Zinc database mining using 2,4-diamino pyrimidine as query scaffold. e Zinc database mining using 2,4-diamino pyrimidine as query scaffold
Pharmacophoric mapping
Virtual screening campaign started with identifying 3D pharmacophoric features in a molecule that are selective for L858R/T790M EGFR-TK inhibition. A systematic diagram of virtual screening protocol is shown in Fig. 3. To create the pharmacophoric hypotheses based on the sites and numbers of pharmacophore points (common in all 24 ligands), maximum four features were permitted for developing the hypotheses. 94 hypotheses have been developed, scored and classified according to their vector, scale, site scores, survival scores and survival activities (Table 1S).
Fig. 3.

In silico modus operandi of virtual screening
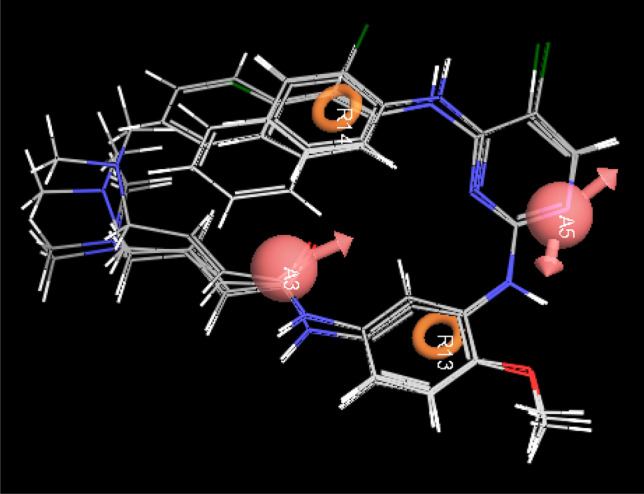
The high scoring AARR.15 hypothesis was selected as the best pharmacophore model with the highest survival rate of 3.436 having two hydrogen bond acceptors and two aromatic ring features. In Figs. 4 and 5, pharmacophoric distances, angles and alignment of active compounds were depicted. The detail of pharmacophoric distance and angles of model AARR.15 is given in Table 2.
Fig. 4.

Distances and angles between the pharmacophoric points of hypothesis AARR.15 (Site 1, 2, 3 and 4). Red ball shows hydrogen bond acceptor site, while the brown ring R demonstrates the ring feature
Fig. 5.
Alignment of the molecules on the AARR.15 hypothesis
Table 2.
Distances and angles of pharmacophoric AARR.15 hypothesis (Model-1)
| Hypothesis | Site 1 | Site 2 | Distance (Å) | Hypothesis | Site 1 | Site 2 | Site 3 | Angles (°) | Hypothesis | Site 1 | Site 2 | Site 3 | Angles (°) |
|---|---|---|---|---|---|---|---|---|---|---|---|---|---|
| AARR.15 | A5 | A3 | 6.670 | AARR.15 | A3 | A5 | R13 | 33.8 | AARR.15 | A5 | R13 | A3 | 111.9 |
| AARR.15 | A5 | R13 | 4.050 | AARR.15 | A3 | A5 | R14 | 36.5 | AARR.15 | A5 | R13 | R14 | 69.4 |
| AARR.15 | A5 | R14 | 5.871 | AARR.15 | A13 | A5 | R14 | 70.3 | AARR.15 | A3 | R13 | R14 | 42.5 |
| AARR.15 | A3 | R13 | 4.000 | AARR.15 | A5 | A3 | R13 | 34.3 | AARR.15 | A5 | R14 | A3 | 82.7 |
| AARR.15 | A3 | R14 | 4.002 | AARR.15 | A5 | A3 | R14 | 60.8 | AARR.15 | A5 | R14 | R13 | 40.2 |
| AARR.15 | A13 | R14 | 5.904 | AARR.15 | R13 | A3 | R14 | 95.1 | AARR.15 | A3 | R14 | R13 | 42.4 |
98 zinc mined compounds were screened through the developed pharmacophore and their alighnment score was calculated. The alignment score filter (Alignment score ≥ 1.75) returned 17 molecules from 98 molecules, and the top hits were ZINC9573445, ZINC9573322, ZINC17013215, ZINC17042782, ZINC24023331, ZINC17013503, ZINC17013499, ZINC9573325, ZINC17307452, ZINC17013303, ZINC17013071, ZINC9573324, ZINC17013429, ZINC17307456, ZINC9573328, ZINC17122729 and ZINC17013227 (Table 3).
Table 3.
Pharmacophoric fitness and alighnment of the screened molecules


Molecular docking against the L858R/T790M EGFR and WT EGFR
The top-scoring 17 compounds were further subjected to the structure-based virtual screening, where they have been docked on mutant (L858R/T790M) and WT EGFR. The molecular docking protocol was validated by re-docking the co-crystalized ligand at the receptor binding site. The co-crystallized ligands were docked with mutant (2JIU) and wild (4ZAU) EGFR binding pockets, and the docked poses were compared to the crystal structure pose by computing the RMSD value, which was found to be 1.2883 Å and 1.0203 Å, respectively (Fig S1, supplementary material). Docking method is generally considered legitimate if the RMSD value is less than 2 Å (Ahmad et al. 2021a, b). In virtual screening, the Cutoff Glide score on mutant EGFR of ≥ − 8.0 and on WT EGFR of ≤ − 6.0 yielded the 16 ligands with ZINCID; ZINC9573324, ZINC09573325, ZINC09573328, ZINC17013071, ZINC17013215, ZINC17013227, ZINC17013303, ZINC17013429, ZINC17013499, ZINC17013503, ZINC17042782, ZINC17122729, ZINC17307452, ZINC24023331, ZINC9573322, ZINC9573445 (Table S2). Virtually potent hit Zinc9573445, showed the H-bond interaction with the ASP 800 of the DFG motif of the L858R/T790M EGFR. The hit ZINC17013227 binds to the hinge region via Met793 and it also forms another two H-bond with Asp855 (ligand-NH–) and Leu745 (ligand terminal methoxy group) of L858R/T790M EGFR. The hit compound ZINC17013215 demonstrated a bidentate hydrogen binding profile, where terminal 3,4,5-trimethoxy amino phenyl moiety showed two hydrogen bonds with a positively charged amino group of Lys716 and Lys728 of L858R/T790M EGFR (Fig. 6). All of these obtained hits were further screened employ the next filter of “Lipinski’s rule of five” and “Jargan’s Rule of Three”.
Fig. 6.

Docking interaction of the virtually screened compounds with L858R/T790M EGFR TK
ADMET calculations
QikProp 3.2 was used to examine drug-likeness (Lipinski's Rule of Five), and results are given in Table S2 (supplementary material) and Table 4. It was found that only 06 of the 16 hits comply with these rules. Different pharmacokinetic parameters of these 6 compounds were further subjected to ADME predictions. The partition coefficient (QPlog Po/w) and water solubility coefficient (QPlogS), which are important for predicting the drug absorption and distribution were within ranged from 4.232 to 4.984 and − 6.816 to − 5.531, respectively. Intestinal absorption or permeation is one of the significant factors to be studied concerning the absorption of the drug molecule. Further, Caco-2 cells (QPPCaco) predicted permeability indicates excellent results in determining the intestinal absorption.
Table 4.
Glide docking score (against the Mutant and WT EGFR), Lipinski’s rule and ADME parameters of the final six ZINC hits
| Criteria | Glide dock score (L858R/T790M EGFR) |
Glide dock score (WT EGFR) |
Lipinski’s rule of five (drug likeliness) | In silico ADME by QikProp, Schordinger 9.0 | |||||||||
|---|---|---|---|---|---|---|---|---|---|---|---|---|---|
| Zinc ID | Docking Score | Glide Energy | Docking Score | Glide Energy |
MWa | Donor HBb |
Accpt HBc |
QPlogPo/w (log p)d | QPlogSe | QPPCacof | QPPMDCKg | QPlogKhsah | Percent human oral absorptioni |
| ZINC17013227 | − 8.136 | − 57.267 | − 5.642 | − 54.836 | 485.541 | 3 | 7.75 | 4.941 | − 6.816 | 1563.187 | 801.776 | 0.646 | 100 |
| ZINC17013215 | − 8.78 | − 56.309 | − 6.062 | − 56.786 | 485.541 | 3 | 7.75 | 4.984 | − 6.526 | 1831.572 | 951.55 | 0.649 | 100 |
| ZINC9573324 | − 8.264 | − 50.666 | − 6.196 | − 52.064 | 419.525 | 3 | 6.25 | 4.871 | − 5.83 | 2449.099 | 1302.626 | 0.674 | 100 |
| ZINC9573445 | − 9.012 | − 60.808 | − 6.297 | − 54.436 | 439.473 | 3 | 7 | 4.232 | − 5.531 | 1853.529 | 963.886 | 0.446 | 100 |
| ZINC24023331 | − 8.916 | − 58.150 | − 6.395 | − 59.549 | 485.541 | 3 | 7.75 | 4.944 | − 6.179 | 2153.064 | 1133.301 | 0.622 | 100 |
| ZINC17013503 | − 8.858 | − 56.066 | − 6.439 | − 55.645 | 425.489 | 3 | 6.25 | 4.838 | − 6.341 | 1792.627 | 929.7 | 0.639 | 100 |
| Rocilatinib | − 7.41 | − 52.568 | − 5.342 | − 53.123 | 499.614 | 2 | 8.75 | 5.302 | − 6.381 | 674.068 | 357.337 | 0.919 | 95.6 |
| Osimertinib | − 8.921 | − 58.868 | − 4.870 | − 48.432 | 555.558 | 3 | 10.25 | 4.289 | − 6.314 | 560.362 | 2127.42 | 0.267 | 88.9 |
aMolecular weight
bHydrogen bond donor
cHydrogen bond acceptor
dPredicted octanol/water partition co-efficient log p (acceptable range: − 2.0 to 6.5)
ePredicted aqueous solubility in mol/L (acceptable range: − 6.5 to 0.5)
fPredicted Caco-2 cell permeability in nm/s (acceptable range: < 25 is poor and > 500 is great)
gPredicted apparent MDCK cell permeability in nm/s
hPrediction of binding to human serum albumin
iPercentage of human oral absorption (< 25% is poor and > 80% is high)
MDCK cells (QPPMDCK) prediction gives an idea about the permeability of the blood brain barrier and QPlogkhsa denotes the human serum albumin binding. All the 06 compounds were falling within the prescribed range. Overall, the percentage of human oral absorption is 100%. These data indicate the drug-like potential of screened 06 compounds (Table 4).
In silico toxicity study and cytochrome profiling
The screened molecules can only be used safely, if they are not harmful to humans. Therefore, in-silico toxicity study and cytochrome profiling for virtual hits were done using the admetSAR tool (Table 5). All the 06 virtually screened compounds were substrate/inhibitors of the CYP-3A4 metabolizing enzyme. Apart from CYP-3A4, ZINC17013227 is inhibitor of CYP-1A2; ZINC9573324 is substrate/inhibitors of CYP-2C9 and CYP-2C19; ZINC9573445 is inhibitors of CYP-1A2 and CYP-2C19; ZINC17013503 is inhibitors of CYP-1A2. Toxicity study indicates that all the six hits were non-carcinogenic and devoid of Ames mutagenesis.
Table 5.
Effect on various metabolic cytochromes enzymes and toxicity assessment obtained from the admetSAR server of the final six ZINC hits
| Zinc ID | CYP-3A4 substrate/inhibitor | CYP-2C9 substrate/inhibitor | CYP-2D6 substrate/inhibitor | CYP-1A2 inhibitor | CYP-2C19 inhibitor | Ames mutagenesis | Carcinogenicity |
|---|---|---|---|---|---|---|---|
| ZINC17013227 | Substrate/inhibitor | Non-substrate | Non-substrate | Inhibitor | Non-inhibitor | Non-toxic | Non-carcinogen |
| ZINC17013215 | Substrate/inhibitor | Non-substrate | Non-substrate | Non-inhibitor | Non-inhibitor | Non-toxic | Non-carcinogen |
| ZINC9573324 | Substrate/inhibitor | Substrate/inhibitor | Non-substrate | Non-inhibitor | Inhibitor | Non-toxic | Non-carcinogen |
| ZINC9573445 | Substrate/inhibitor | Non-substrate | Non-substrate | Inhibitor | Inhibitor | Non-toxic | Non-carcinogen |
| ZINC24023331 | Substrate/inhibitor | Non-substrate | Non-substrate | Non-inhibitor | Non-inhibitor | Non-toxic | Non-carcinogen |
| ZINC17013503 | Substrate/inhibitor | Non-substrate | Non-substrate | Inhibitor | Non-inhibitor | Non-toxic | Non-carcinogen |
The identification of a drug’s potential metabolic sites can provide crucial information about its pharmacokinetic and pharmacodynamic properties. Mostly drugs are metabolized by a special class of enzymes which are known as cytochrome P450 (CYP) enzymes. Among CYP enzymes, CYP3A4 is the most abundantly expressed CYP and accounts for approximately 30–40% of the total CYP content in human adult liver and small intestine. SMARTCyp was used to predict the CYP3A4-derived site of metabolism. The prediction of the best three sites of metabolism of the six virtual hits is presented in Fig. 7. The terminal methyl group (–OCH3) of compounds ZINC17013227, ZINC17013215, ZINC9573324, ZINC17013503 and ZINC24023331 are ranked as the best SOM. This is followed by the 6-methyl group attached to the pyrimidine ring. For the compound ZINC17013227 and ZINC9573324, the amino group attached to pyrimidine ring at second position are regarded as the SOM. For the compound ZINC9573445, the methylene group (–CH–) between the oxygen of the benzodiaoxole ring was identified as the SOM. In compound ZINC9573445 and ZINC17013503 the –CH– of amino phenyl are predicted as the SOM.
Fig. 7.

Representation of the site of metabolism (SOM) of six virtual hits predicted by SMARTCy
MM-GBSA (ΔGbind) calculation
The six virtual hit protein–ligand complexes were analyzed by MM-GBSA (ΔGbind), to determine ligands’ affinities with the protein receptors. The binding energies calculated by this approach are more effective than the Glide Score values for protein–ligand complex selection (Table 6). Among the six complexes studied, ZINC9573445–L858R/T790M EGFR showed high binding free energy (ΔG bind = − 37.104 kcal/mol) while ZINC17013227-L858R/T790M EGFR had the second-highest binding free energy (ΔGbind = − 36.855 kcal/mol).
Table 6.
Binding free energy calculations of the protein–ligand complexes obtained by MM-GBSA analysis
| Zinc ID | Prime MMGBSA Ligand Energy |
Prime MMGBSA ΔG bind |
Prime MMGBSA ΔG bind vdW |
Prime MMGBSA ΔG bind Solv GB |
|---|---|---|---|---|
| ZINC17013227 | − 135.954 | − 36.855 | − 24.769 | 26.850 |
| ZINC17013215 | − 128.904 | − 34.095 | − 26.265 | 40.096 |
| ZINC9573324 | − 132.624 | − 30.681 | − 19.054 | 24.829 |
| ZINC9573445 | − 137.977 | − 29.522 | − 28.334 | 36.283 |
| ZINC24023331 | − 128.195 | − 37.104 | − 23.043 | 29.874 |
| ZINC17013503 | − 134.347 | − 34.352 | − 25.369 | 26.518 |
| Co-crystalized Ligand | − 145.156 | − 51.20 | − 38.88 | 25.52 |
Ligand Energy: Prime energy; ΔGbind: Gibbs energy of binding; ΔG vdW: Van der Waals energy; ΔG Solv GB: Generalized Born electrostatic solvation energy
DFT calculation
To validate the pharmacophore based and structure based virtual screening, DFT calculation was performed by B3LYP/6-31G** basic set (single point energy calculation) of the six-hit compounds. The HOMO and LUMO energy describe how the molecule interacts with other species and helps to understand the chemical reactivity and kinetic stability of the molecule, while electronic and optical properties of the molecule can be derived from the HOMO–LUMO energy gap (ΔE) (Panwar and Singh 2020; Amala et al. 2019) The HOMO is the orbital of highest energy (electron-rich), has the potential to give electrons, and LUMO is the lowest-lying orbital that is empty (lack of the electron) has the potential to accept electrons (Chinnasamy et al. 2019). The energy of HOMO, LUMO, their energy gap (ΔE) and molecular electrostatic potential surface (MESP) of best six-hit is tabularized in Table 7. Presence of negative values of HOMO–LUMO all compounds implies good stability, which is essential to form the stable ligand–protein complex. Additionally, the energy gap represents a useful tool to determine the most active compounds.
Table 7.
Single point energy (Jaguar) calculations of frontier orbital energies
| Compounds | HOMO (eV) | HOMO (eV) | Energy gap/ΔE (eV) | MESP (kcal/mol) |
|---|---|---|---|---|
| ZINC 9573445 | − 0.182627 | − 0.034994 | − 0.147633 | − 46.1767 to 43.2420 |
| ZINC 17013503 | − 0.186684 | − 0.035744 | − 0.15094 | − 43.8887 to 43.7169 |
| ZINC 2402331 | − 0.181064 | − 0.028768 | − 0.152296 | − 45.4253 to 44.9598 |
| ZINC 17013215 | − 0.187215 | − 0.03352 | − 0.153695 | − 42.6457 to 45.5245 |
| ZINC 9573324 | − 0.18544 | − 0.009679 | − 0.175761 | − 37.2584 to 43.5196 |
| ZINC 17013227 | − 0.182098 | 0.032281 | − 0.214379 | − 45.0902 to 41.8367 |
The ΔE value decreases accordingly: ZINC9573445 (− 0.147633 eV) < ZINC17013503 (− 0.15094) < ZINC 2402331 (− 0.152296 eV) < ZINC17013215 (− 0.153695 eV) < ZINC 09573324 (− 0.175761 eV) < ZINC17013227 (− 0.214379 eV)
Less energy gap between the HOMO and LUMO energies has a considerable impact on the intermolecular charge transfer and bioactivity of compounds (Amala et al. 2019). Consequently, a more energy gap observed in the compounds negatively affect the electron to move from the HOMO to the LUMO, which subsequently led to a weak affinity of the inhibitor for L858R/T790M EGFR TK.
Hence, the reactivity order increases according to: ZINC9573445 (− 0.147633 eV) > ZINC17013503 (− 0.15094 eV) > ZINC 2402331 (− 0.152296 eV) > ZINC17013215 (− 0.153695 eV) > ZINC 09573324 (− 0.175761 eV) > ZINC17013227 (− 0.214379 eV), where the most reactive is clearly ZINC9573445 (− 0.147633 eV). Among the identified six hits, less energy gap was observed with ZINC9573445 (ΔE = − 0.147633 eV), where the HOMO orbitals are located in the phenyl aminopyrimidine group and LUMO are located on the carbonyl benzodiaoxole group (Fig. 8).
Fig. 8.

HOMO, LUMO and MESP of ZINC9573445
The molecular electrostatic potential surface (MESP) provides details about charge distribution (positive and negative) and also identify the reactive sites for electrophilic and nucleophilic attack in a compound for binding to protein in protein substrate interactions. The different charges are denoted in different colours. The red colour indicates negative potential (negative regions) which has the affinity to attract protons; the blue colour represents the positive potential (positive regions) which has the affinity to repulse proton and green colour represents zero potential. The negative region plays a vital role in forming a hydrogen bonding with the protein (Panwar and Singh 2020; Amala et al. 2019; Chinnasamy et al. 2019). In ZINC9573445, the most negative potential is located at the carboxamide, benzodiaoxole ring (Fig. 8). This region may be liable for hydrogen bonding interaction with the protein. This is well correlated with pharmacophore-based and structure-based virtual screening.
Molecular dynamic simulation study
In the docking studies, the flexibility of the protein was not taken into consideration; therefore we have assessed drug-receptor interactions in the dynamic condition using molecular dynamic simulation to obtain the stable binding confirmation and further validate the docking result. ZINC9573445 in complex with EGFR T790M was considered for the molecular dynamic simulation for 200 ns in simple point charge (SPC) water mode. The stability of the protein–ligand complex was observed by comparing Root Mean Square Deviation (RMSD), Root Mean Square Fluctuation (RMSF) values with respect to unbound protein structure. RMSD is used to determine the average variation in the displacement of a selection of atoms for a particular frame with respect to the initial frame. As small as the RMSD value in the simulation, it is correlated with the higher stability of the protein–ligand complex (Ahmad et al. 2020). The RMSD plot of ZINC9573445–EGFRL858R/T790M complex is depicted in Fig. 9. The plot exhibited minor fluctuation of protein up to 3.7 Å, while ligand initially showed an increasing trend in RMSD from 60 to 120 ns having RMSD value range from 1.6 to 3.4 Å. Between the simulation timescale 50–120 ns, the ligand RMSD increased due to the rearrangement of ligand pose for better binding and stability within the EGFR binding Pocket. After 120 ns promising result was observed and the graph line became stable until 200 ns having a constant RMSD value of 4.8 Å. The RMSF plot represents the mobility and flexibility of each protein residue during the simulation. More RMSF values show more flexibility during the simulation while the lower value of RMSF reflects the good stability of the system (Ahmad et al. 2020). In this plot, Protein residues that contacts with the ligand are indicated with vertical green lines, Alpha-helical and beta-strand regions are displayed in red and blue backgrounds, respectively, while white background indicates loop region.
Fig. 9.

Time-dependent plot of protein–ligand RMSD (Angstrom) of the ZINC9573445–EGFR L858R/T790M complex
Secondary structural elements such as alpha helices and beta strands typically are rigid than the unstructured part of the protein and thus fluctuate less than the loop regions. High fluctuations were observed in N- and C terminal region compared to any other part of the protein. If the active site’s fluctuation and the main chain atoms were mild, it indicated that the conformational change was slight (Hang et al. 2018). The RMSF plot confirmed that the ligand contacted residues showed less fluctuation from 0.8 to 1.7 Å (Fig. 10). Changes of the order of 1–3 Å are perfectly acceptable for small globular proteins.
Fig. 10.

Time-dependent Protein RMSF plots (Angstrom) of the ZINC9573445–EGFR L858R/T790M complex
Furthermore, protein interaction with the ligand can be monitored throughout the simulation. These interactions are categorized into hydrogen bonds, hydrophobic, and water bridges, as shown in Fig. 11. Hydrogen bond interaction plays an imperative role in strong bond formation in ligand binding, which was seen with Ser720, Pro794, Asp800 and Asp 855.
Fig. 11.

Simulation Interactions Diagram, (2D binding interaction of ZINC9573445 along with bar diagram indicating the fold of interaction fraction and contacts, Hbonds, hydrophobic, ionic, water bridges)
Water mediated hydrogen bonds were also seen with Asp 855, Arg 841 and Lys 728. Hydrophobic interactions were also seen with Leu718, Ala743, Met790, and Leu844. Additionally, the (Fig. 12) shows total number of specific contacts protein makes with ligand over the course of trajectory. The contribution of amino acids in each trajectory frame of 200 ns MD simulation as shown in bottom panel of Fig. 12 which represent the number of contacts and their density, i.e., a darker shade of orange shows more than one contact in that frame. Key interactions seen during each frame were Asp800, which found consistent during the complete simulation process. Other interactions were also found Leu718, Lys728, Ala743, Met790, Leu841 and Asp85, which were not consistent during the simulation.
Fig. 12.

Interaction shown by the active site amino acids in each trajectory frame of ZINC9573445–EGFR T790M complex
Conclusion
3D Pharmacophore identification was carried out using a reported 2,4-disubstituted-pyrimidines with well-defined EGFR L858R/T790M kinase inhibitory activity. Pharmacophore-based and structure-based virtual screenings identified six hits with potential in silico activity against EGFR L858R/T790M kinase. Molecular docking study indicates that hydrogen-bond interactions with Lys716, Lys728, and Leu745, Asp800, DFG motif of Asp855 and hinge residue M793 key for EGFR T790M domain affinity. The ADME properties of the hits were calculated and found to be within an acceptable range. In silico toxicity and cytochrome, profiling indicates that all the 06 virtually screened compounds were substrate/inhibitors of the CYP-3A4 metabolizing enzyme and were non-carcinogenic and devoid of Ames mutagenesis. DFT calculation, using the B3LYP/6-31G** basic set further validates the ligand-based and structure-based virtual screening (Fig. 13).
Fig. 13.

Structures and ZINC IDs of final 6 best hits obtained through ligand-based and structure-based virtual screening
The top potential hit, ZINC9573445 was subjected to molecular dynamics simulation in order to check the overall stability of the protein–ligand complex. Molecular dynamics simulation suggested that docked ZINC9573445–EGFR T790M complex was stable for 200 ns. Currently we are synthesizing these screened molecules at our lab and additional experimental validation will be planned and the results will be reported in due course.
Supplementary Information
Below is the link to the electronic supplementary material.
Acknowledgements
The authors would like to thank “Indian Council of Medical Research (ICMR), Govt. of India” (Grant No. ISRM/12(11)/2019) for funding the project.
Author contributions
RP, IA and HP was involved in the idea generation and performing the computational chemistry work. SS have contributed for the manuscript writing and grammatical check.
Funding
The authors would like to thank ‘Indian Council of Medical Research (ICMR) Ministry of Health and Family Welfare, Department of Health Research Govt. of India’ (Grant No. ISRM/12(11)/2019) for funding the project.
Availability of data and materials
Additional data is provided in Supplementary Information.
Declarations
Conflict of interest
All authors declare no actual or potential conflict of interest including any financial, personal, or other relationships with other people or organizations.
Ethical approval
Not applicable.
Consent to participate
Not applicable.
Consent for publication
Not applicable.
Footnotes
Publisher's Note
Springer Nature remains neutral with regard to jurisdictional claims in published maps and institutional affiliations.
References
- Ahmad I, Shaikh M, Surana S, Ghosh A, Patel H (2020) p38α MAP kinase inhibitors to overcome EGFR tertiary C797S point mutation associated with osimertinib in non-small cell lung cancer (NSCLC): emergence of fourth-generation EGFR inhibitor. J Biomol Struct Dyn 1–14 [DOI] [PubMed]
- Ahmad I, Kumar D, Patel H. Computational investigation of phytochemicals from Withania somnifera (Indian ginseng/ashwagandha) as plausible inhibitors of GluN2B-containing NMDA receptors. J Biomol Struct Dyn. 2021;10:1–13. doi: 10.1080/07391102.2021.1905553. [DOI] [PubMed] [Google Scholar]
- Ahmad I, Jadhav H, Shinde Y, Jagtap V, Girase R, Patel H. Optimizing Bedaquiline for cardiotoxicity by structure based virtual screening, DFT analysis and molecular dynamic simulation studies to identify selective MDR-TB inhibitors. In Silico Pharmacol. 2021;23(9):23. doi: 10.1007/s40203-021-00086-x. [DOI] [PMC free article] [PubMed] [Google Scholar]
- Amala M, Rajamanikandan S, Prabhu D, Surekha K, Jeyakanthan J. Identification of anti-filarial leads against aspartate semialdehyde dehydrogenase of Wolbachia endosymbiont of Brugia malayi: combined molecular docking and molecular dynamics approaches. J Biomol Struct Dyn. 2019;37(2):394–410. doi: 10.1080/07391102.2018.1427633. [DOI] [PubMed] [Google Scholar]
- Benet LZ, Hosey CM, Ursu O, Oprea TI. BDDCS, the rule of 5 and drugability. Adv Drug Deliv Rev. 2016;101:89–98. doi: 10.1016/j.addr.2016.05.007. [DOI] [PMC free article] [PubMed] [Google Scholar]
- Bhadoriya KS, Sharma MC, Jain SV. Pharmacophore modeling and atom-based 3D-QSAR studies on amino derivatives of indole as potent isoprenylcysteine carboxyl methyltransferase (Icmt) inhibitors. J Mol. 2015;1081:466–476. [Google Scholar]
- Bochevarov AD, Harder E, Hughes TF, Greenwood JR, Braden DA, Philipp DM, Rinaldo D, Halls MD, Zhang J, Friesner RA. Jaguar: a high-performance quantum chemistry software program with strengths in life and materials sciences. Int J Quantum Chem. 2013;113(18):2110–2142. doi: 10.1002/qua.24481. [DOI] [Google Scholar]
- Bonomi P. Erlotinib: a new therapeutic approach for non-small cell lung cancer. Expert Opin Inv Drug. 2003;12:1395–1401. doi: 10.1517/13543784.12.8.1395. [DOI] [PubMed] [Google Scholar]
- Bowers KJ, Chow DE, Xu H, Dror RO, Eastwood MP, Gregersen BA, Klepeis JL, Kolossvary I, Moraes MA, Sacerdoti FD, Salmon JK (2006) Scalable algorithms for molecular dynamics simulations on commodity clusters. In: SC'06: Proceedings of the (2006), ACM/IEEE Conference on Supercomputing, pp 43–43
- Chabon JJ, Simmons AD, Lovejoy AF, Esfahani MS, Newman AM, Haringsma HJ, Kurtz DM, Stehr H, Scherer F, Karlovich CA, Harding TC, Durkin KA, Otterson GA, Purcell WT, Camidge DR, Goldman JW, Sequist LV, Piotrowska Z, Wakelee HA, Neal JW, Alizadeh AA, Diehn M. Circulating tumour DNA profiling reveals heterogeneity of EGFR inhibitor resistance mechanisms in lung cancer patients. Nat Commun. 2016;7:11815. doi: 10.1038/ncomms11815. [DOI] [PMC free article] [PubMed] [Google Scholar]
- Chan S, Han K, Qu R, Tong L, Li Y, Zhang Z, Cheng H, Lu X, Patterson A, Smaill J, Ren X. 2, 4-Diarylamino-pyrimidines as kinase inhibitors co-targeting IGF1R and EGFRL858R/T790M. Bioorg Med Chem Lett. 2015;25:4277–4281. doi: 10.1016/j.bmcl.2015.07.089. [DOI] [PubMed] [Google Scholar]
- Chaudhari P, Bari S. in silico exploration of c-KIT inhibitors by pharmaco-informatics methodology: pharmacophore modeling, 3D QSAR, docking studies, and virtual screening. Mol Divers. 2016;20:41–53. doi: 10.1007/s11030-015-9635-x. [DOI] [PubMed] [Google Scholar]
- Chekkara R, Kandakatla N, Gorla VR, Tenkayala SR, Susithra E. Theoretical studies on benzimidazole and imidazo [1, 2-a] pyridine derivatives as Polo-like kinase 1 (Plk1) inhibitors: pharmacophore modeling, atom-based 3D-QSAR and molecular docking approach. J Saudi Chem Soc. 2017;21:S311–S321. doi: 10.1016/j.jscs.2014.03.007. [DOI] [Google Scholar]
- Chen F, Liu H, Sun H, Pan P, Li Y, Li D, Hou T. Assessing the performance of the MM/PBSA and MM/GBSA methods. 6. Capability to predict protein–protein binding free energies and re-rank binding poses generated by protein–protein docking. Phys Chem Chem Phys. 2016;18:22129–22139. doi: 10.1039/C6CP03670H. [DOI] [PubMed] [Google Scholar]
- Chen L, Fu W, Zheng L, Liu Z, Liang G. Recent progress of small-molecule epidermal growth factor receptor (EGFR) inhibitors against C797S resistance in non-small-cell lung cancer: miniperspective. J Med Chem. 2017;61:4290–4300. doi: 10.1021/acs.jmedchem.7b01310. [DOI] [PubMed] [Google Scholar]
- Chinnasamy S, Selvaraj G, Kaushik AC, Kaliamurthi S, Chandrabose S, Singh SK, Thirugnanasambandam R, Gu K, Wei DQ. Molecular docking and molecular dynamics simulation studies to identify potent AURKA inhibitors: Assessing the performance of density functional theory, MM-GBSA and mass action kinetics calculations. J Biomol Struct Dyn. 2019;38:1–11. doi: 10.1080/07391102.2019.1674695. [DOI] [PubMed] [Google Scholar]
- Cho K, Joannopoulos JD, Kleinman L. Constant-temperature molecular dynamics with momentum conservation. Phys Rev E. 1993;47(5):3145. doi: 10.1103/PhysRevE.47.3145. [DOI] [PubMed] [Google Scholar]
- Choubey SK, Jeyaraman J. A mechanistic approach to explore novel HDAC1 inhibitor using pharmacophore modeling, 3D-QSAR analysis, molecular docking, density functional and molecular dynamics simulation study. J Mol Graph Model. 2016;70:54–69. doi: 10.1016/j.jmgm.2016.09.008. [DOI] [PubMed] [Google Scholar]
- Chow E, Rendleman CA, Bowers KJ, Dror RO, Hughes DH, Gullingsrud J, Sacerdoti FD (2008) Desmond performance on a cluster of multicore processors. DE Shaw Research Technical Report DESRES. TR 01. https://deshawresearch.com
- Cohen MH, Williams GA, Sridhara R, Chen G, Pazdur R. FDA drug approval summary: gefitinib (ZD1839)(Iressa) tablets. Clin Oncol. 2003;8:303–306. doi: 10.1634/theoncologist.8-4-303. [DOI] [PubMed] [Google Scholar]
- Deniz U, Ozkirimli E, Ulgen KO. A systematic methodology for large scale compound screening: a case study on the discovery of novel S1PL inhibitors. J Mol Graph Mode. 2016;63:110–124. doi: 10.1016/j.jmgm.2015.11.004. [DOI] [PubMed] [Google Scholar]
- Dixon SL, Smondyrev AM, Knoll EH, Rao SN, Shaw DE, Friesner RA. PHASE: a new engine for pharmacophore perception, 3D QSAR model development, and 3D database screening: 1. Methodology and preliminary results. J Comput Aided Mol. 2006;20:647–671. doi: 10.1007/s10822-006-9087-6. [DOI] [PubMed] [Google Scholar]
- Dixon SL, Smondyrev AM, Rao SN. PHASE: a novel approach to pharmacophore modeling and 3D database searching. Chem Biol Drug Des. 2006;67:370–372. doi: 10.1111/j.1747-0285.2006.00384.x. [DOI] [PubMed] [Google Scholar]
- Doak BC, Kihlberg J. Drug discovery beyond the rule of 5-Opportunities and challenges. Expert Opin Drug Discov. 2017;12:115–119. doi: 10.1080/17460441.2017.1264385. [DOI] [PubMed] [Google Scholar]
- Dong X, Zheng W. A new structure-based QSAR method affords both descriptive and predictive models for phosphodiesterase-4 inhibitors. Curr Chem Genom. 2008;2:29. doi: 10.2174/1875397300802010029. [DOI] [PMC free article] [PubMed] [Google Scholar]
- Elokely KM, Doerksen RJ. Docking challenge: protein sampling and molecular docking performance. J Chem Inf Model. 2013;53:1934–1945. doi: 10.1021/ci400040d. [DOI] [PMC free article] [PubMed] [Google Scholar]
- Engelman JA, Jänne PA. Mechanisms of acquired resistance to epidermal growth factor receptor tyrosine kinase inhibitors in non–small cell lung cancer. Clin Cancer Res. 2008;14:2895–2899. doi: 10.1158/1078-0432.CCR-07-2248. [DOI] [PubMed] [Google Scholar]
- Evans DJ, Holian BL. The nose–hoover thermostat. J Chem Phys. 1985;83:4069–4074. doi: 10.1063/1.449071. [DOI] [Google Scholar]
- Golbraikh A, Tropsha A. Beware of q2? J Mol Graph Model. 2002;20:269–276. doi: 10.1016/S1093-3263(01)00123-1. [DOI] [PubMed] [Google Scholar]
- Golbraikh A, Shen M, Xiao Z, Xiao YD, Lee KH, Tropsha A. Rational selection of training and test sets for the development of validated QSAR models. J Comput Aided Mol Des. 2003;17:241–253. doi: 10.1023/A:1025386326946. [DOI] [PubMed] [Google Scholar]
- Goss G, Tsai CM, Shepherd FA, Bazhenova L, Lee JS, Chang GC, Crino L, Satouchi M, Chu Q, Hida T, Han JY. Osimertinib for pretreated EGFR Thr790Met-positive advanced non-small-cell lung cancer (AURA2): a multicentre, open-label, single-arm, phase 2 study. Lancet Oncol. 2016;17:1643–1652. doi: 10.1016/S1470-2045(16)30508-3. [DOI] [PubMed] [Google Scholar]
- Hang H, Ma G, Zhu Y, Zeng L, Ahmad A, Wang C, Pang B, Fang H, Zhao L, Hao Q (2018) Active-site conformational fluctuations promote the enzymatic activity of NDM-1. Antimicrob Agents Chemother 62:e01579–18 [DOI] [PMC free article] [PubMed]
- Hirsch FR, Varella-Garcia M, Bunn PA, Di Maria MV, Veve R, Bremnes RM, Barón AE, Zeng C, Franklin WA. Epidermal growth factor receptor in non–smcall-cell lung carcinomas: correlation between gene copy number and protein expression and impact on prognosis. Int J Clin Oncol. 2003;21:3798–3807. doi: 10.1200/JCO.2003.11.069. [DOI] [PubMed] [Google Scholar]
- http://dude.docking.org/targets/egfr
- https://www.drugs.com/history/tagrisso.html
- https://www.rcsb.org/structure/2JIU
- https://www.rcsb.org/structure/4ZAU
- Jafari F, Nowroozi A, Shahlaei M. Discovery of novel glucagon receptor antagonists using combined pharmacophore modeling and docking. Iran J Pharm Res: IJPR. 2018;17:1263. [PMC free article] [PubMed] [Google Scholar]
- Jänne PA, Yang JCH, Kim DW, Planchard D, Ohe Y, Ramalingam SS, Ahn MJ, Kim SW, Su WC, Horn L, Haggstrom D. AZD9291 in EGFR inhibitor–resistant non–small-cell lung cancer. N Engl J Med. 2015;372:1689–1699. doi: 10.1056/NEJMoa1411817. [DOI] [PubMed] [Google Scholar]
- Jordaan MA, Ebenezer O, Damoyi N, Shapi M. Virtual screening, molecular docking studies and DFT calculations of FDA approved compounds similar to the non-nucleoside reverse transcriptase inhibitor (NNRTI) efavirenz. Heliyon. 2020;6(8):e04642. doi: 10.1016/j.heliyon.2020.e04642. [DOI] [PMC free article] [PubMed] [Google Scholar]
- Kandakatla N, Ramakrishnan G, Karthikeyan J, Chekkara R. Pharmacophore modeling, atom based 3D-QSAR and docking studies of chalcone derivatives as tubulin inhibitors. Orient J Chem. 2014;30:1083–1098. doi: 10.13005/ojc/300320. [DOI] [Google Scholar]
- Kausar S, Falcao AO. An automated framework for QSAR model building. J Cheminformatics. 2018;10:1. doi: 10.1186/s13321-017-0256-5. [DOI] [PMC free article] [PubMed] [Google Scholar]
- Kawahara A, Yamamoto C, Nakashima K, Azuma K, Hattori S, Kashihara M, Aizawa H, Basaki Y, Kuwano M, Kage M, Mitsudomi T. Molecular diagnosis of activating EGFR mutations in non–small cell lung cancer using mutation-specific antibodies for immunohistochemical analysis. Clin Cancer Res. 2010;16:3163–3170. doi: 10.1158/1078-0432.CCR-09-3239. [DOI] [PubMed] [Google Scholar]
- Kennedy T. Managing the drug discovery/development interface. Drug Discov. 1997;2:436–444. [Google Scholar]
- Khadikar PV, Karmarkar S, Agrawa VK. A novel PI index and its applications to QSPR/QSAR studies. J Chem Inf Comput Sci. 2001;41:934–949. doi: 10.1021/ci0003092. [DOI] [PubMed] [Google Scholar]
- Khan MF, Verma G, Akhtar W, Shaquiquzzaman M, Akhter M, Rizvi MA, Alam MM. Pharmacophore modeling, 3D-QSAR, docking study and ADME prediction of acyl 1, 3, 4-thiadiazole amides and sulfonamides as antitubulin agents. Arab J Chem. 2019;12:5000–5018. doi: 10.1016/j.arabjc.2016.11.004. [DOI] [Google Scholar]
- Kim Y, Ko J, Cui Z, Abolhoda A, Ahn JS, Ou SH, Ahn MJ, Park K. The EGFR T790M mutation in acquired resistance to an irreversible second-generation EGFR inhibitor. Mol Cancer Ther. 2012;11:784–791. doi: 10.1158/1535-7163.MCT-11-0750. [DOI] [PubMed] [Google Scholar]
- Kobayashi S, Boggon TJ, Dayaram T, Jänne PA, Kocher O, Meyerson M, Johnson BE, Eck MJ, Tenen DG, Halmos B. EGFR mutation and resistance of non–small-cell lung cancer to gefitinib. N Engl J Med. 2005;352:786–792. doi: 10.1056/NEJMoa044238. [DOI] [PubMed] [Google Scholar]
- Kumar V, Elizabeth Sobhia M. Implication of crystal water molecules in inhibitor binding at ALR2 active site. Comput Math Method Med. 2012 doi: 10.1155/2012/541594. [DOI] [PMC free article] [PubMed] [Google Scholar]
- Lipinski CA, Lombardo F, Dominy BW, Feeney PJ. Experimental and computational approaches to estimate solubility and permeability in drug discovery and development settings. Adv Drug Deliv Rev. 1997;23:3–25. doi: 10.1016/S0169-409X(96)00423-1. [DOI] [PubMed] [Google Scholar]
- Lu X, Yu L, Zhang Z, Ren X, Smaill JB, Ding K. Targeting EGFRL858R/T790M and EGFRL858R/T790M/C797S resistance mutations in NSCLC: Current developments in medicinal chemistry. Med Res Rev. 2018;38:1550–1581. doi: 10.1002/med.21488. [DOI] [PubMed] [Google Scholar]
- Lyne PD, Lamb ML, Saeh JC. Accurate prediction of the relative potencies of members of a series of kinase inhibitors using molecular docking and MM-GBSA scoring. J Med Chem. 2006;49:4805–4808. doi: 10.1021/jm060522a. [DOI] [PubMed] [Google Scholar]
- Molina JR, Yang P, Cassivi SD, Schild SE, Adjei AA. Non-small cell lung cancer: epidemiology, risk factors, treatment, and survivorship. Mayo Clin Proc. 2008;83:584–594. doi: 10.1016/S0025-6196(11)60735-0. [DOI] [PMC free article] [PubMed] [Google Scholar]
- Mysinger MM, Carchia M, Irwin JJ, Shoichet BK. Directory of useful decoys, enhanced (DUD-E): better ligands and decoys for better benchmarking. J Med Chem. 2012;55:6582–6594. doi: 10.1021/jm300687e. [DOI] [PMC free article] [PubMed] [Google Scholar]
- Noolvi MN, Patel HM. A comparative QSAR analysis and molecular docking studies of quinazoline derivatives as tyrosine kinase (EGFR) inhibitors: a rational approach to anticancer drug design. J Saudi Chem Soc. 2013;17:361–379. doi: 10.1016/j.jscs.2011.04.017. [DOI] [Google Scholar]
- Ohsaki YO, Tanno SA, Fujita Y, Toyoshima E, Fujiuchi S, Nishigaki Y, Ishida S, Nagase A, Miyokawa N, Hirata S, Kikuchi K. Epidermal growth factor receptor expression correlates with poor prognosis in non-small cell lung cancer patients with p53 overexpression. Curr Oncol Rep. 2000;7:603–610. doi: 10.3892/or.7.3.603. [DOI] [PubMed] [Google Scholar]
- Pan Y, Wang Y, Bryant SH. Pharmacophore and 3D-QSAR characterization of 6-arylquinazolin-4-amines as Cdc2-like kinase 4 (Clk4) and dual specificity tyrosine-phosphorylation-regulated kinase 1A (Dyrk1A) inhibitors. J Chem Inf Model. 2013;53:938–947. doi: 10.1021/ci300625c. [DOI] [PMC free article] [PubMed] [Google Scholar]
- Panwar U, Singh SK. Atom-based 3D-QSAR, molecular docking, DFT, and simulation studies of acylhydrazone, hydrazine, and diazene derivatives as IN-LEDGF/p75 inhibitors. J Struct Chem. 2020;32:1–16. [Google Scholar]
- Pao W, Miller VA, Politi KA, Riely GJ, Somwar R, Zakowski MF, Kris MG, Varmus H. Acquired resistance of lung adenocarcinomas to gefitinib or erlotinib is associated with a second mutation in the EGFR kinase domain. PLoS Med. 2005;2:e73. doi: 10.1371/journal.pmed.0020073. [DOI] [PMC free article] [PubMed] [Google Scholar]
- Patel H, Pawara R, Ansari A, Surana S. Recent updates on third generation EGFR inhibitors and emergence of fourth generation EGFR inhibitors to combat C797S resistance. Eur J Med Chem. 2017;142:32–47. doi: 10.1016/j.ejmech.2017.05.027. [DOI] [PubMed] [Google Scholar]
- Patel H, Ansari A, Pawara R, Ansari I, Jadhav H, Surana S. Design and synthesis of novel 2, 4-disubstituted aminopyrimidines: reversible non-covalent T790M EGFR inhibitors. J Recept Signal Transduct Res. 2018;38(5–6):393–412. doi: 10.1080/10799893.2018.1557207. [DOI] [PubMed] [Google Scholar]
- Patel H, Pawara R, Surana S. In-silico evidences for binding of Glucokinase activators to EGFR C797S to overcome EGFR resistance obstacle with mutant-selective allosteric inhibition. Comput Biol Chem. 2018;74:167–189. doi: 10.1016/j.compbiolchem.2018.03.026. [DOI] [PubMed] [Google Scholar]
- Patel H, Dhangar K, Sonawane Y, Surana S, Karpoormath R, Thapliyal N, Shaikh M, Noolvi M, Jagtap R. In search of selective 11β-HSD type 1 inhibitors without nephrotoxicity: an approach to resolve the metabolic syndrome by virtual based screening. Arab J Chem. 2018;11:221–232. doi: 10.1016/j.arabjc.2015.08.003. [DOI] [Google Scholar]
- Patel S, Modi P, Chhabria M. Rational approach to identify newer caspase-1 inhibitors using pharmacophore based virtual screening, docking and molecular dynamic simulation studies. J Mol Graph Model. 2018;8:106–115. doi: 10.1016/j.jmgm.2018.02.017. [DOI] [PubMed] [Google Scholar]
- Patel H, Ahmad I, Jadhav H, Pawara R, Lokwani D, Surana S. Investigating the impact of different acrylamide (electrophilic warhead) on osimertinib's pharmacological spectrum by molecular mechanic and quantum mechanic approach. Comb Chem High Throughput Screen. 2020 doi: 10.2174/1386207323666201204125524. [DOI] [PubMed] [Google Scholar]
- Patel HM, Shaikh M, Ahmad I, Lokwani D, Surana BREED based de novo hybridization approach: generating novel T790M/C797S-EGFR tyrosine kinase inhibitors to overcome the problem of mutation and resistance in non-small cell lung cancer (NSCLC) J Biomol Struct Dyn. 2020;39:1–19. doi: 10.1080/07391102.2020.1844804. [DOI] [PubMed] [Google Scholar]
- Patel HM, Ahmad I, Pawara R, Shaikh M, Surana SJ. In silico search of triple mutant T790M/C797S allosteric inhibitors to conquer acquired resistance problem in non-small cell lung cancer (NSCLC): a combined approach of structure-based virtual screening and molecular dynamics simulation. J Biomol Struct Dyn. 2020;39:1–15. doi: 10.1080/07391102.2020.1844804. [DOI] [PubMed] [Google Scholar]
- Prabhu K, Manoj Kumar M, Gopalakrishnan VK. Pharmacophore modeling and QSAR study of Thieno [3, 2-b] pyrimidine analogs as VEGFR-2 inhibitors. Int J Pharm Pharm Sci. 2014;6:200–207. [Google Scholar]
- QikProp (2010) version 9.0, Schrodinger, LLC. New York, NY
- Raghu R, Devaraji V, Leena K, Riyaz SD, Baby Rani P, Kumar Naik P, Dubey PK, Velmurugan D, Vijayalakshmi M. Virtual screening and discovery of novel aurora kinase inhibitors. Curr Top Med Chem. 2014;14:2006–2019. doi: 10.2174/1568026614666140929151140. [DOI] [PubMed] [Google Scholar]
- Roy K, Kar S, Ambure P. on a simple approach for determining applicability domain of QSAR models. Chemometr Intell Lab. 2015;145:22–29. doi: 10.1016/j.chemolab.2015.04.013. [DOI] [Google Scholar]
- Rydberg P, Gloriam DE, Zaretzki J, Breneman C, Olsen L. SMARTCyp: a 2D method for prediction of cytochrome P450-mediated drug metabolism. ACS Med Chem Lett. 2010;1(3):96–100. doi: 10.1021/ml100016x. [DOI] [PMC free article] [PubMed] [Google Scholar]
- Rydberg P, Rostkowski M, Gloriam DE, Olsen L. The contribution of atom accessibility to site of metabolism models for cytochromes P450. Mol Pharm. 2013;10:1216–1223. doi: 10.1021/mp3005116. [DOI] [PubMed] [Google Scholar]
- Sastry GM, Adzhigirey M, Day T, Annabhimoju R, Sherman W. Protein and ligand preparation: parameters, protocols, and influence on virtual screening enrichments. J Comput Aided Mol Des. 2013;27:221–234. doi: 10.1007/s10822-013-9644-8. [DOI] [PubMed] [Google Scholar]
- Shaikh M, Shinde Y, Pawara R, Noolvi M, Surana S, Ahmad I, Patel H. Emerging approaches to overcome acquired drug resistance obstacles to osimertinib in non-small-cell lung cancer. J Med Chem. 2021 doi: 10.1021/acs.jmedchem.1c00876. [DOI] [PubMed] [Google Scholar]
- Sharma SV, Bell DW, Settleman J, Haber DA. Epidermal growth factor receptor mutations in lung cancer. Nat Rev Cancer. 2007;7:169–181. doi: 10.1038/nrc2088. [DOI] [PubMed] [Google Scholar]
- Sharma V, Kumar H, Wakode S. Pharmacophore generation and atom based 3D-QSAR of quinoline derivatives as selective phosphodiesterase 4B inhibitors. RSC Adv. 2016;6:75805–75819. doi: 10.1039/C6RA11210B. [DOI] [Google Scholar]
- Shen M, Béguin C, Golbraikh A, Stables JP, Kohn H, Tropsha A. Application of predictive QSAR models to database mining: identification and experimental validation of novel anticonvulsant compounds. J Med Chem. 2004;47:2356–2364. doi: 10.1021/jm030584q. [DOI] [PubMed] [Google Scholar]
- Shinoda W, Mikami M. Rigid-body dynamics in the isothermal-isobaric ensemble: a test on the accuracy and computational efficiency. J Comput Chem. 2003;24:920–930. doi: 10.1002/jcc.10249. [DOI] [PubMed] [Google Scholar]
- Shivakumar D, Williams J, Wu Y, Damm W, Shelley J, Sherman W. Prediction of absolute solvation free energies using molecular dynamics free energy perturbation and the OPLS force field. J Chem Theory Comput. 2010;6:1509–1519. doi: 10.1021/ct900587b. [DOI] [PubMed] [Google Scholar]
- Singh KD, Karthikeyan M, Kirubakaran P, Nagamani S. Pharmacophore filtering and 3D-QSAR in the discovery of new JAK2 inhibitors. J Mol Graph Model. 2011;30:186–197. doi: 10.1016/j.jmgm.2011.07.004. [DOI] [PubMed] [Google Scholar]
- Song Z, Ge Y, Wang C, Huang S, Shu X, Liu K, Zhou Y, Ma X. Challenges and perspectives on the development of small-molecule EGFR inhibitors against T790M-mediated resistance in non-small-cell lung cancer: miniperspective. J Med Chem. 2016;59:6580–6594. doi: 10.1021/acs.jmedchem.5b00840. [DOI] [PubMed] [Google Scholar]
- Tawari NR, Bag S, Degani MS. Pharmacophore mapping of a series of pyrrolopyrimidines, indolopyrimidines and their congeners as multidrug-resistance-associated protein (MRP1) modulators. J Mol. 2008;14:911–921. doi: 10.1007/s00894-008-0330-z. [DOI] [PubMed] [Google Scholar]
- Teli MK, Rajanikant GK. Pharmacophore generation and atom-based 3D-QSAR of N-iso-propyl pyrrole-based derivatives as HMG-CoA reductase inhibitors. Org Med Chem Lett. 2012;2:25. doi: 10.1186/2191-2858-2-25. [DOI] [PMC free article] [PubMed] [Google Scholar]
- Thress KS, Paweletz CP, Felip E, Cho BC, Stetson D, Dougherty B, Lai Z, Markovets A, Vivancos A, Kuang Y, Ercan D. Acquired EGFR C797S mutation mediates resistance to AZD9291 in non–small cell lung cancer harboring EGFR T790M. Nat Med. 2015;21:560–562. doi: 10.1038/nm.3854. [DOI] [PMC free article] [PubMed] [Google Scholar]
- Tropsha A, Gramatica P, Gombar VK. The importance of being earnest: validation is the absolute essential for successful application and interpretation of QSPR models. Qsar Comb Sci. 2003;22:69–77. doi: 10.1002/qsar.200390007. [DOI] [Google Scholar]
- Ugale VG, Bari SB. Identification of potential Gly/NMDA receptor antagonists by cheminformatics approach: a combination of pharmacophore modelling, virtual screening and molecular docking studies. Sar Qsar Environ Res. 2016;27(2):125–145. doi: 10.1080/1062936X.2015.1136679. [DOI] [PubMed] [Google Scholar]
- Ugale VG, Patel HM, Surana SJ. Molecular modeling studies of quinoline derivatives as VEGFR-2 tyrosine kinase inhibitors using pharmacophore based 3D QSAR and docking approach. Arab J Chem. 2017;10:S1980–S2003. doi: 10.1016/j.arabjc.2013.07.026. [DOI] [Google Scholar]
- Vansteenkiste JF, Schildermans RH. The future of adjuvant chemotherapy for resected non-small cell lung cancer. Expert Rev Anticancer Ther. 2005;5(1):165–175. doi: 10.1586/14737140.5.1.165. [DOI] [PubMed] [Google Scholar]
- Verma G, Khan MF, Akhtar W, Alam MM, Akhter M, Alam O, Hasan SM, Shaquiquzzaman M. Pharmacophore modeling, 3D-QSAR, docking and ADME prediction of quinazoline based EGFR inhibitors. Arab J Chem. 2019;12:4815–4839. doi: 10.1016/j.arabjc.2016.09.019. [DOI] [Google Scholar]
- Wang J, Li Y, Yang Y, Zhang J, Du J, Zhang S, Yang L. Profiling the interaction mechanism of indole-based derivatives targeting the HIV-1 gp120 receptor. RSC Adv. 2015;5:78278–78298. doi: 10.1039/C5RA04299B. [DOI] [Google Scholar]
- Yun CH, Mengwasser KE, Toms AV, Woo MS, Greulich H, Wong KK, Meyerson M, Eck MJ. The T790M mutation in EGFR kinase causes drug resistance by increasing the affinity for ATP. Proc Natl Acad Sci. 2008;105:2070–2075. doi: 10.1073/pnas.0709662105. [DOI] [PMC free article] [PubMed] [Google Scholar]
- Zhou W, Ercan D, Chen L, Yun CH, Li D, Capelletti M, Cortot AB, Chirieac L, Iacob RE, Padera R, Engen JR. Novel mutant-selective EGFR kinase inhibitors against EGFR T790M. Nature. 2009;462:1070–1074. doi: 10.1038/nature08622. [DOI] [PMC free article] [PubMed] [Google Scholar]
Associated Data
This section collects any data citations, data availability statements, or supplementary materials included in this article.
Supplementary Materials
Data Availability Statement
Additional data is provided in Supplementary Information.