Figure 4.
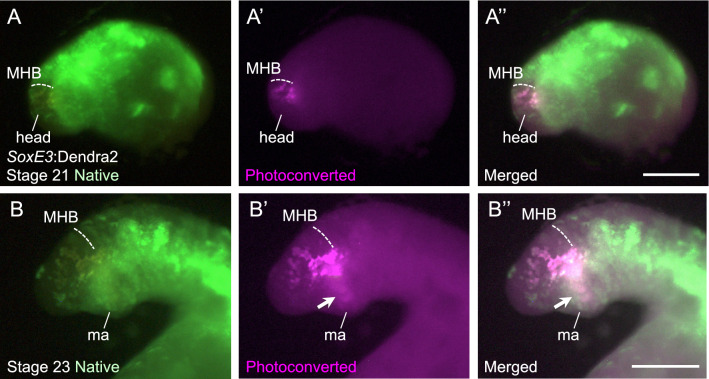
Cell lineage analysis of photoconverted SoxE3:Dendra2 knock-in lampreys. (A) Photoconversion experiments were performed in the head region of SoxE3:Dendra2 knock-in lampreys at stage 21. Native green fluorescence, photoconverted red fluorescence (shown in magenta), and the merged image are shown in (A), (A’), and (A’’), respectively. The midbrain–hindbrain boundary (MHB) is indicated with dashed lines. Scale bar: 500 μm. (B) The same animal shown in (A) is raised to the stage 24 and reexamined. Some photoconverted cells are observed in the mandibular arch (ma), suggesting ventral migration of these NCC cells (arrows). Native green fluorescence, photoconverted red fluorescence (shown in magenta), and the merged image are shown in (B), (B’), and (B’’), respectively. The midbrain–hindbrain boundary (MHB) is indicated with dashed lines. Scale bar: 200 μm.

