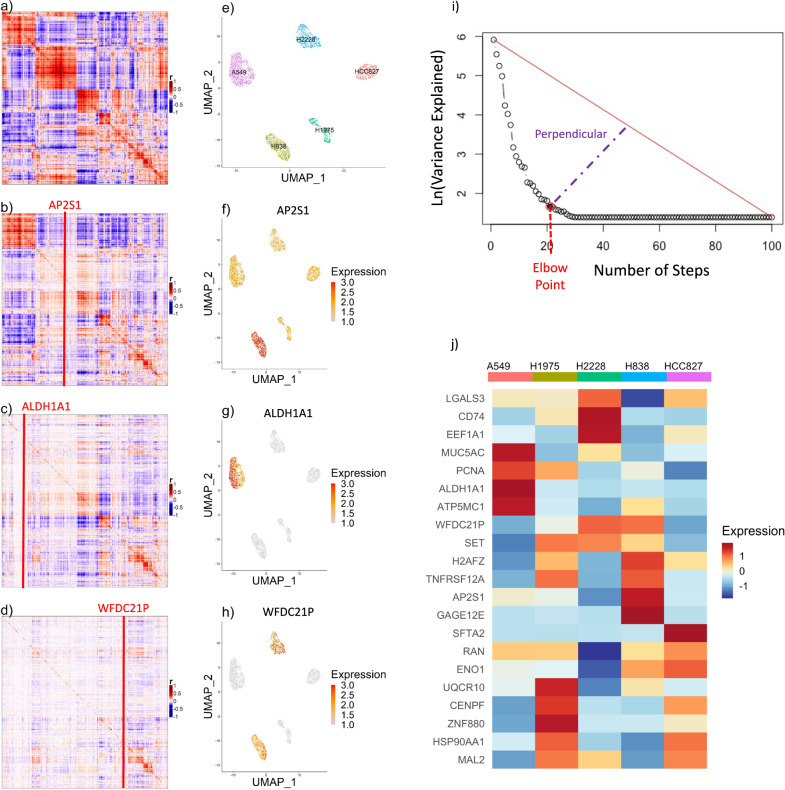
Fig. 3. Stepwise regression to identify a minimally redundant feature subset.
a Gene–gene correlation matrix of candidate feature genes (high correlation range score). b–d Residuals from stepwise regression on the gene–gene correlation matrix. e UMAP visualization of cells in an optimal feature space, colored by cell line. f–h Same UMAP, colored by expression of genes regressed out in the first three steps. i Scree plot: variance in GGC matrix explained by the gene regressed out at each step. j Standardized average expression of the final seed gene set in each of the 5 cell lines. r: Pearson correlation.

