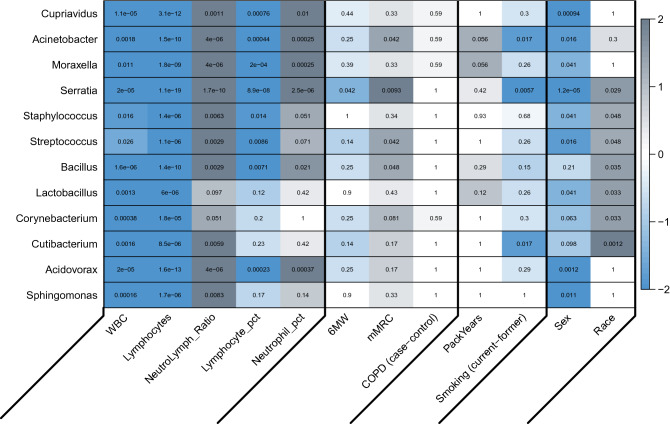
Figure 2.
Heatmap of the associations between genera inferred abundance and host-related variables for the meta-analysis. Variables with at least one finding with FDR < 10% were included. The value in each cell is the adjusted q-value. The color scale for the cells represents the sign of the effect multiplied by negative log10 of the q-values, with intensity proportional to significance and gray shading representing positively correlated associations and blue shading representing negatively correlated associations. Results with discordant directions of effect in the meta-analysis are set to q = 1 (white) (heatmap produced using the labeledHeatmap function from the R package WGCNA45). Variables with at least one significant association are included (WBC = white blood cell count, Lymphocytes = lymphocyte count, NeutroLymph_Ratio = ratio of neutrophil counts to lymphocyte counts, Lymphocyte_pct = percentage of lymphocytes, Neutrophil_pct = percentage of neutrophils, 6 MW = six-minute walk distance, mMRC = Modified Medical Research Council dyspnea score, COPD (case–control) = COPD cases vs. controls, PackYears = pack-years history of smoking, Smoking (current-former) = current vs. former smoking status).

