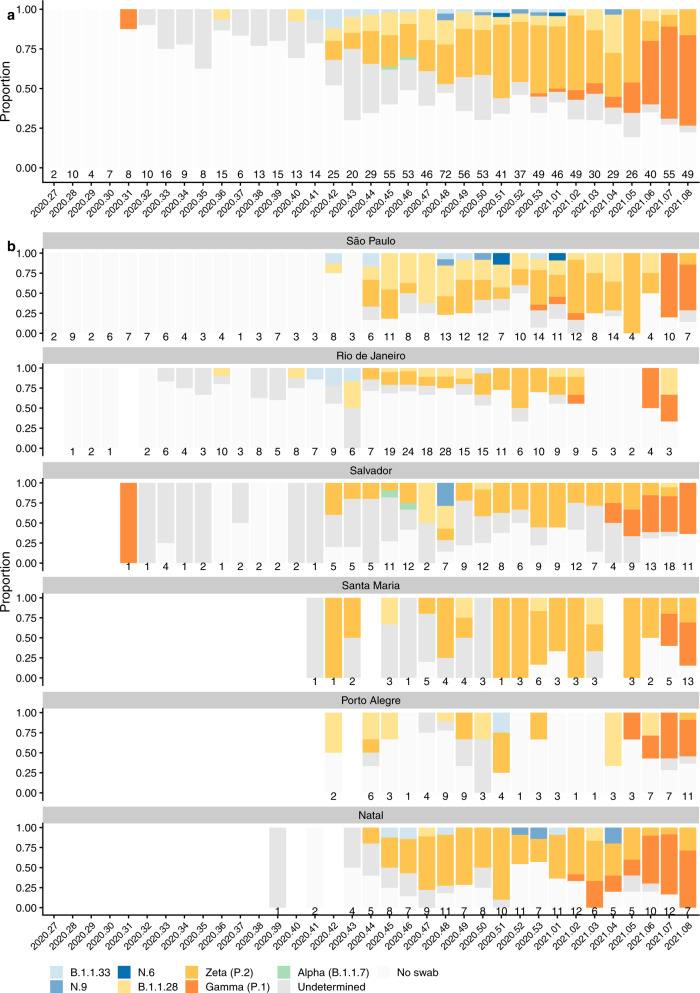
Fig. 2. Distribution of SARS-CoV-2 lineages from nose/throat swabs over time.
a Stacked bar chart of cases of NAAT + SARS-CoV-2 each week during the study, with lineage assigned by sequencing or genotyping where available. b Stacked bar chart of cases of NAAT + SARS-CoV-2 each week during the study, by study site, with lineage assigned by sequencing or genotyping where available. The 6 study sites are are: Sao Paulo, Rio de Janeiro, Salvador, Santa Maria, and Porto Alegre. (see map of sites in Supplementary Fig. 3). X-axis labels show calendar year and week number. Numbers above the x-axis show the number of cases of NAAT + SARS-CoV-2 that occurred in the study during that week. Swabs were available for sequencing and genotyping only if participants were tested at a study site laboratory and the study sample was stored. An early sample from August 2020 was assigned to Gamma (P.1) to the presence of the K417T mutation. Phylogeographic analyses suggest emergence of the dominant P.1 lineage in November 2020, with a most recent common ancestor of all P.1-like (K417T) viruses estimated at August 202048. As low viral load of this sample in our dataset precluded sequencing, we were unable to further refine its phylogenetic lineage. Therefore it is plausible that this sample was a precursor to likely ‘true’ Gamma (P.1) or a spontaneous K417T mutation. In keeping with national surveillance data, multiple instances of Gamma (P.1) samples were observed in our data from January 2021.

