
Fig. 4. An X-ray co-crystal structure and functional assessment of 11.
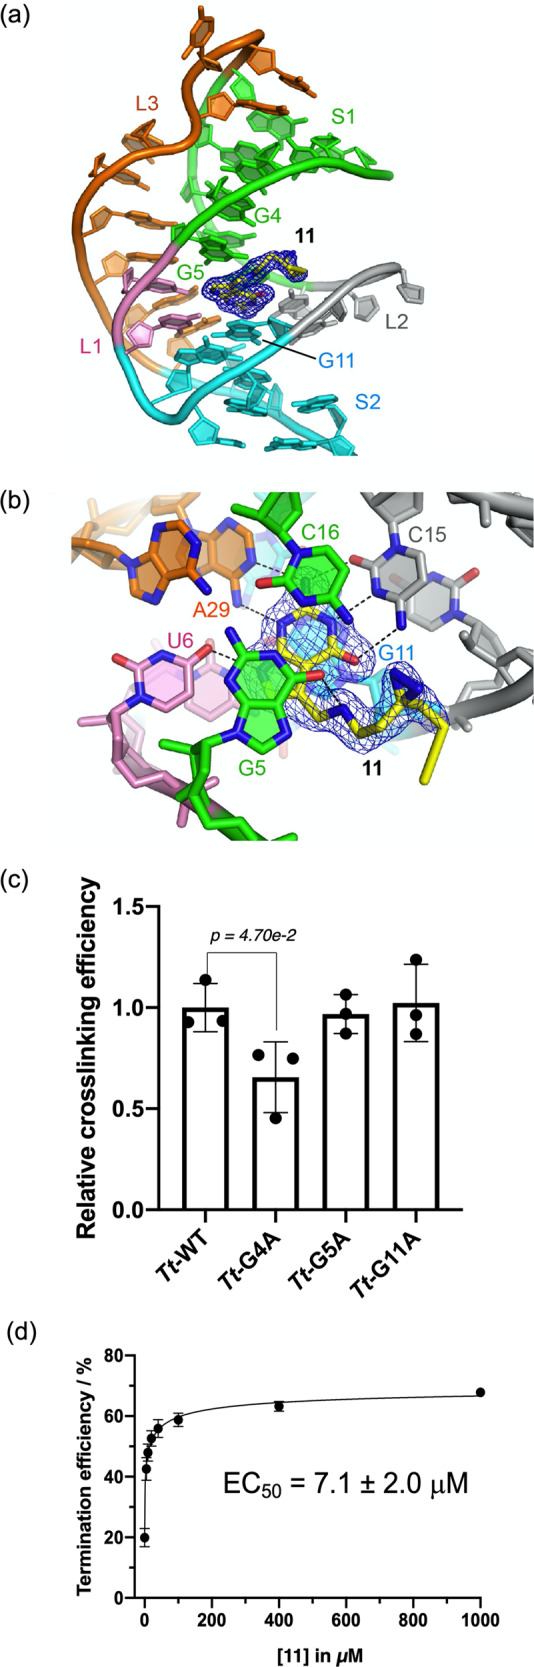
a Co-crystal structure showing interaction of compound 11 with the Tt-preQ1-RS aptamer (ab_13-14) solved at 1.57 Å resolution. S1, S2, L1, L2, and L3 are colored green, cyan, pink, gray, and orange, respectively. The mFo – DFc electron density maps for the compound are colored blue and contoured at 3.0 σ. b Detail of ligand:RNA interaction showing conservation of contacts seen with unmodified PreQ1. The nucleotides that interact with the compound are labeled, and hydrogen bonds are indicated as dotted lines. Residues at the site of the interaction are labeled to show the proximity of G5 and G11 to the diazirine. The mFo – DFc electron density maps for the compound are also shown as in a. c Bar graph representing the photocrosslinking efficiency of wild-type Tt-preQ1-RS aptamer (Tt-WT) and three different mutant aptamers (Tt-G4A, Tt-G5A, and Tt-G11A) to Probe 11. d Single-round transcription termination assay results for compound 11. Quantification of transcription termination efficiency with increasing concentrations of 11 was calculated based on the band intensity of read-through transcription product (RT) and terminated transcription product (T). Data are presented as the mean ± SEM (n = 3) of three independent experiments. Statistical significance was calculated by two-tailed t-test analysis. Source data are provided as a Source Data file.