
Fig. 6. Selective enrichment of Bs-preQ1-RS aptamer by 11 in total human RNA with Bs-preQ1-RS aptamer spiked in.
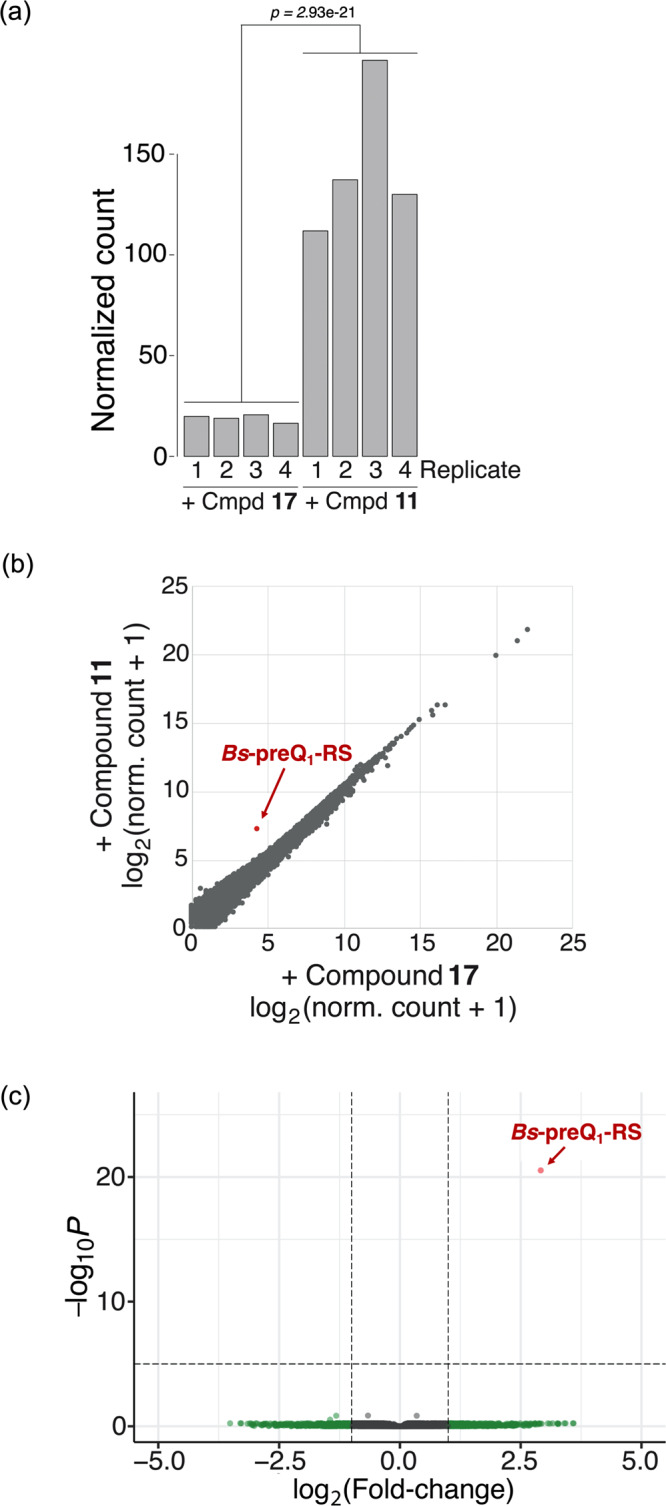
a Comparison of the normalized counts of the Bs-preQ1-RS aptamer across 11 and 17 treated samples shows significantly higher counts in all four replicates of 11 treated samples. Statistical significance was calculated by two-tailed t-test analysis. b Correlation plot showing differential gene enrichment for compounds 11 and 17. The gene entry corresponding to the Bs-preQ1-RS is labeled in red. c Volcano plot from differential expression analysis between 11 and 17. The gene entry corresponding to the Bs-preQ1-RS is labeled in red. p = adjusted p-value. All analyses performed on four independent replicate samples treated with 11 or 17.