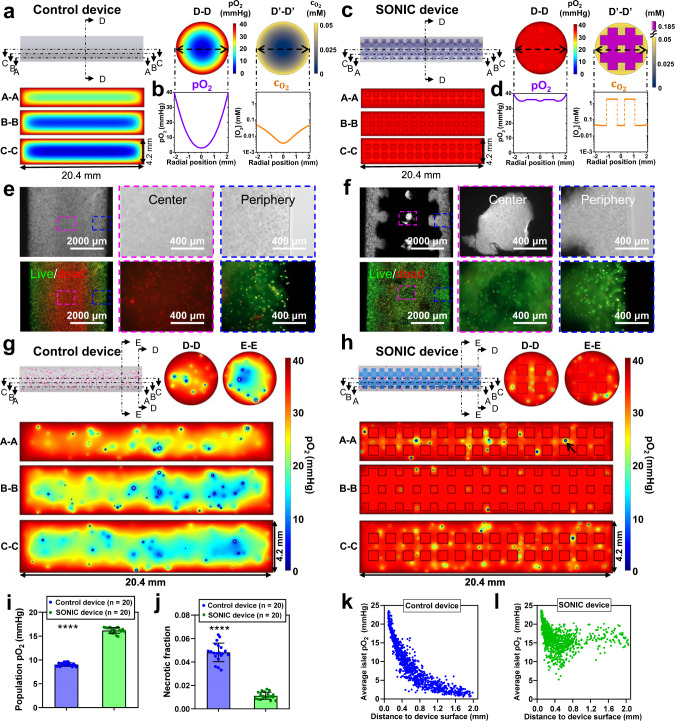
Fig. 4. The SONIC scaffold improves cell survival under hypoxic conditions.
a Simulation-predicted pO2 distributions of INS-1 cells encapsulated control device in three tangential cross-sections (labeled A-A, B-B, and C-C) and a transverse cross-section (labeled D-D, a corresponding distribution labeled as D’-D’). b Quantitative pO2 and distributions along a radial line in the transverse cross-section of the control device showing rapid O2 dropping from 40 mmHg (0.05 mM) at the surface to ~3 mmHg (0.004 mM) at the center. c Simulation-predicted pO2 distributions of INS-1 cells encapsulated SONIC device in three tangential cross-sections and a transverse cross-section. d Quantitative pO2 and distributions along a radial line in the transverse cross-section of the SONIC device showing high pO2 over 35 mmHg in the whole device, corresponding with high over 0.044 mM in the cell/hydrogel phase and a substantially higher of ~1.85 mM in the SONIC scaffold due to the preferential partitioning of O2 into the gas-containing SONIC scaffold. e, f Microscope images of live/dead staining of INS-1 cells encapsulated in the control device (e) and the SONIC device (f). One representative of 2 independent experiments is shown. g Simulation-predicted pO2 distributions of rat islets (size-distributed) in a control device in three tangential cross-sections (labeled A–A, B-B, and C-C) and two transverse cross-sections (labeled D-D and E-E) showing massive hypoxic regions in the center of the device with necrosis observed in many islets (white regions in the islets represent necrosis). h Simulation-predicted pO2 distributions of rat islets (size-distributed) in a SONIC device in three tangential cross-sections (labeled A-A, B-B, and C-C) and two transverse cross-sections (labeled D–D and E-E) showing well-oxygenated islets in the entire device, with negligible necrosis observed in rare large islets (arrow in A-A cross-section). i, j Average pO2 (i) and fraction of necrosis (j) of the islet populations in control devices (n = 20), and SONIC devices (n = 20). Mean ± SD, ****p < 0.0001 (unpaired two-sided students t-test). k, l Scatter plots of islet location versus average pO2 in simulated islets (all 150 µm in diameter) in control devices (k) and SONIC devices (l).

