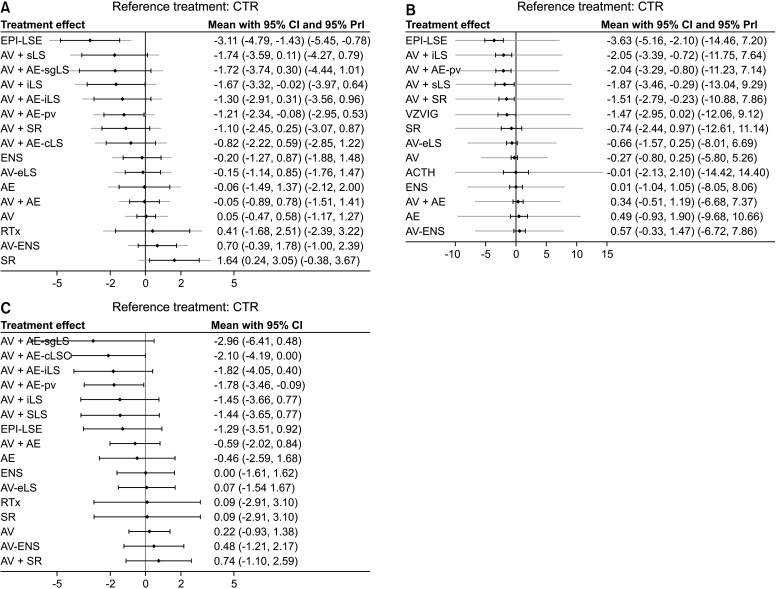
Fig. 4.
Predictive interval plots (PrIs) compared with control. A diamond shape represents the mean summary effects. The black line represents the 95% confidence interval (CI), and the red line represents the PrI. PrIs provide an interval that is expected to encompass the estimate of a future study. (A) The incidence of postherpetic neuralgia at 3 months after acute herpes zoster, (B) the incidence of postherpetic neuralgia at 1 month after acute herpes zoster, and (C) the incidence of postherpetic neuralgia at 6 months after acute herpes zoster. CTR: control, RTx: radiotherapy, VZVIG: varicella zoster vaccine immunoglobulin, ACTH: adrenocorticotrophic hormone.

