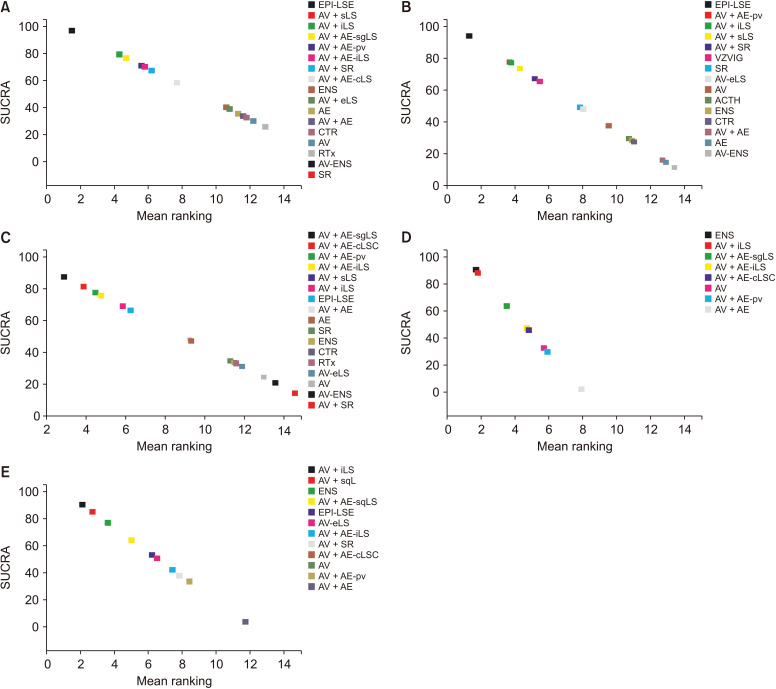
Fig. 5.
The expected mean ranking and surface of under cumulative ranking curve (SUCRA) values for each strategy. The X-axis corresponds to the expected mean ranking based on the SUCRA value, and the Y-axis corresponds to the SUCRA value. (A) The incidence of postherpetic neuralgia at 3 months after acute herpes zoster, (B) the incidence of postherpetic neuralgia at 1 month after acute herpes zoster, (C) the incidence of postherpetic neuralgia at 6 months after acute herpes zoster, (D) pain score measured at 3 months after acute herpes zoster, and (E) pain score measured at 1 month after acute herpes zoster.

