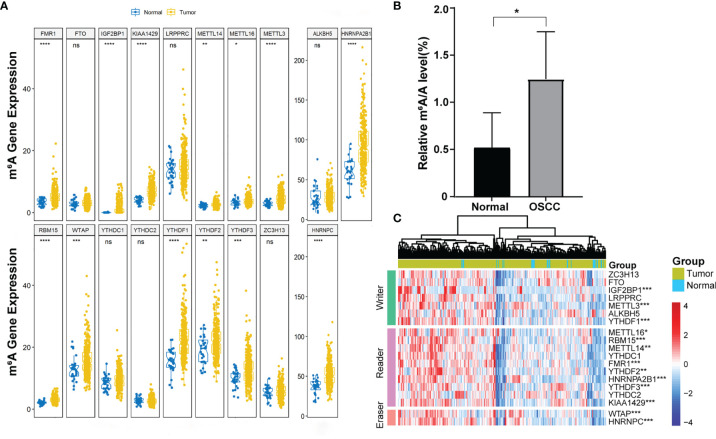
Figure 1.
The expression of 19 m6A-related genes in OSCC. (A) Boxplot visualizing the expression of m6A-related genes in 330 OSCC samples and 32 normal samples. (B) m6A level was detected in six pairs of OSCC tissues and adjacent normal tissues (p < 0.05). (C) The expression levels of 19 m6A-related genes in OSCC were displayed via a heatmap. The ascending normalized expression level in the heatmaps is colored from blue to red. *, **, *** and **** indicated p<0.05, p<0.01, p<0.001 and p<0.0001, respectively. “ns” indicates no significance.

