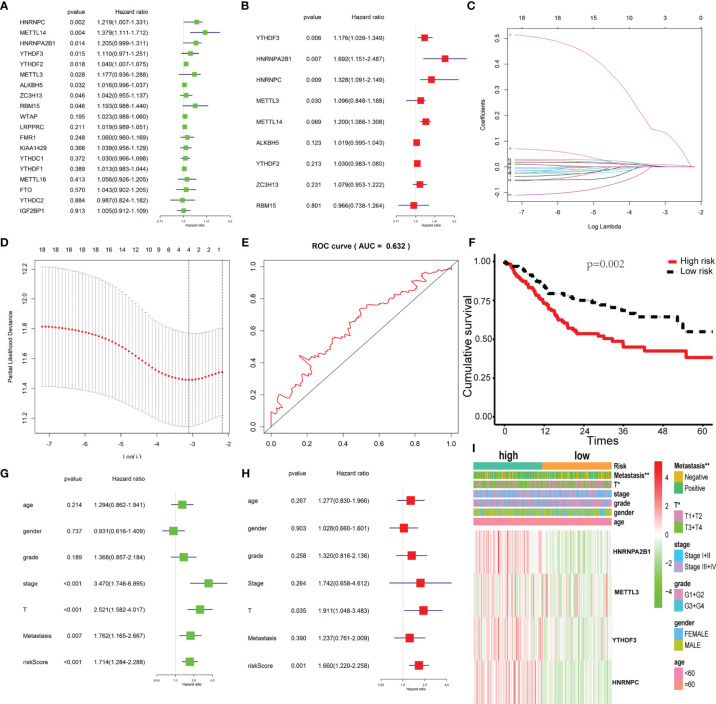
Figure 3.
Construction of the Cox regression model and validation of the prognostic signature. (A, B) Univariate and multivariate cox regression based on 19 m6A-related genes. (C) LASSO coefficient profiles of 19 m6A-related genes associated with the overall survival of OSCC; each curve represents a gene. (D) Partial likelihood deviance is shown against log (lambda). The vertical dotted line indicated the lambda value with the minimum error and the largest lambda value, where the deviance is within one SE of the minimum. (E) The prognostic signature model showed good prediction efficiency with the area under the ROC curve (AUC = 0.632). (F) Survival analysis based on risk score. (G, H) Univariate cox regression and multivariate cox regression according to risk score and clinical characteristics. (I) The heatmap of risk score level and clinical characteristics. * and ** indicated p<0.05 and p<0.01, respectively.

