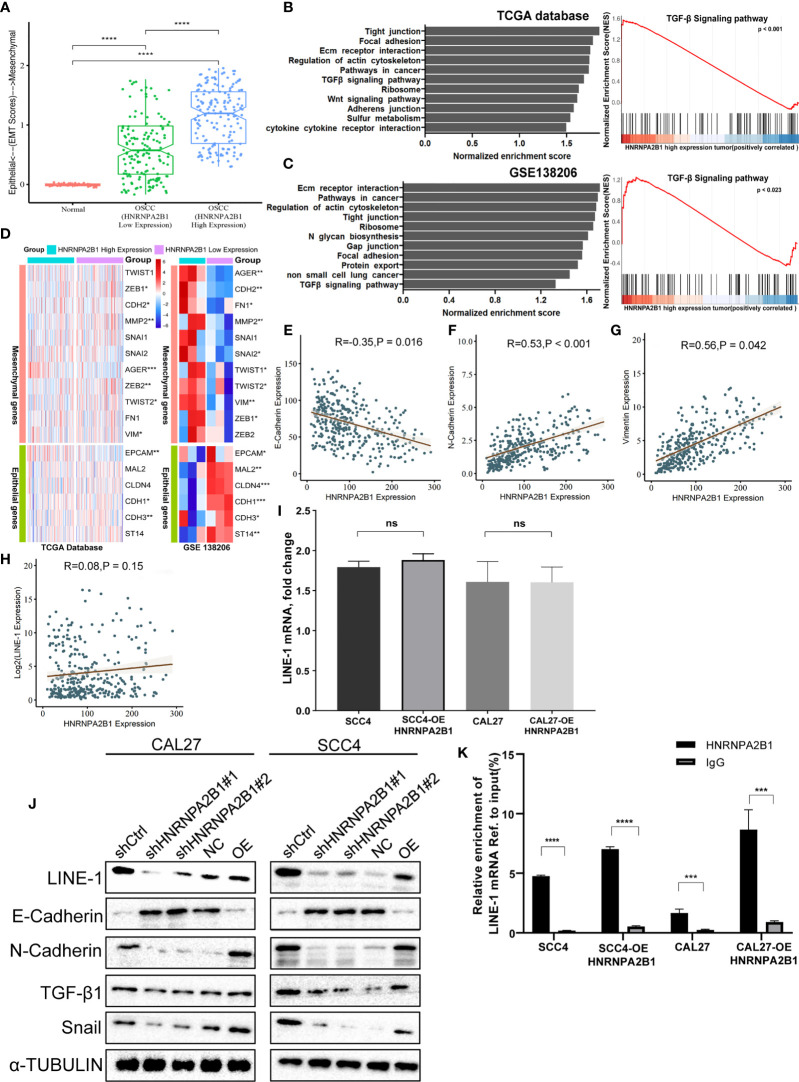
Figure 7.
HNRNPA2B1 is correlated with the EMT process in OSCC. (A) EMT scores in normal and OSCC tissues. (B, C) Gene set enrichment analyses show the upregulated genes for HNRNA2B1 high-expression patients compared to low-expression patients. (D) GSE data (GSE138206) and TCGA data show that HNRNPA2B1 is correlated with multiple EMT markers. (E–H) HNRNPA2B1 expression is negatively correlated with E-cadherin (R = -0.35, p < 0.05) expression and positively correlated with N-cadherin (R = 0.53, p < 0.05) and vimentin (R = 0.56, p < 0.05), but was not correlated with the LINE-1 mRNA expression (R = 0.08, p = 0.15). (I) LINE-1 mRNA expression was not correlated with the HNRNPA2B1 expression in OSCC cell lines. (J) Western blot analysis of EMT markers related with LINE-1/TGF-β1/Snail signaling pathway. Protein levels of N-cadherin, E-cadherin, TGF-β1, Snail, and LINE-1 ORF1 of CAL27 and SCC4 cells were detected by Western blot after HNRNPA2B1 was knocked down or overexpressed. (K) Relative enrichment of LINE-1 mRNA associated with HNRNPA2B1 protein was identified by RIP assays using anti-IgG and anti-HNRNPA2B1 antibodies. The IgG group was a negative control to preclude nonspecific binding. The Y-axis represents the percent of input for each IP sample according to the formula: %Input =1/10*2Ct [IP]-Ct [input]. *, **, *** and **** indicated p<0.05, p<0.01, p<0.001 and p<0.0001, respectively. “ns” indicates no significance.

