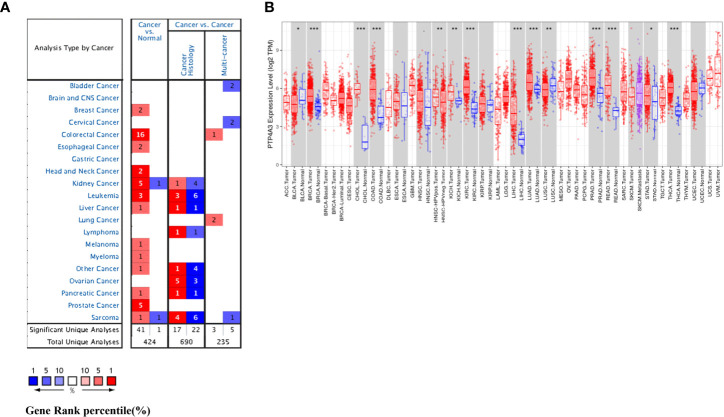
Figure 1.
PTP4A3 mRNA levels in various tumor tissues and adjacent normal tissues. (A) Differential PTP4A3 mRNA levels between tumor and adjacent normal tissues across various cancer types in the Oncomine database (threshold P-value < 0.001, fold change 1.5, gene rank top 5%). (B) Differential PTP4A3 expression levels between tumor and adjacent normal tissues in the TIMER datasets. Blue code represents low expression of indicated tumor. Red code represents high expression of indicated tumor (*P < 0.05, **P < 0.01, ***P < 0.001).

