Figure 4.
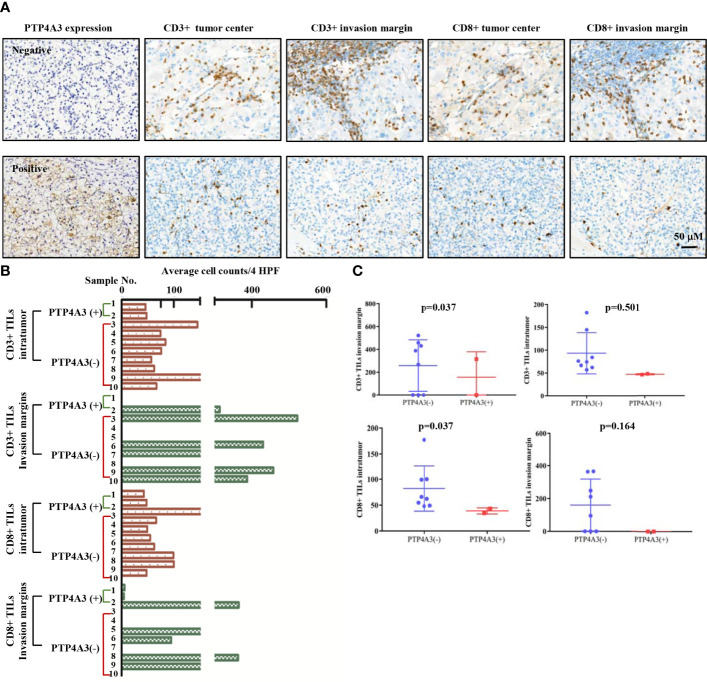
PTP4A3 expression associates with low CD3+/CD8+ infiltration in renal cancers. (A) Representative IHC stain in 10 renal tumor tissues. PTP4A3 negative stains (upper panel) and positive stains (lower panel) with CD3+ intratumor stains, CD3+ invasion margins stains, CD8+ intratumor stains, CD8+ invasion margins stains, 20× magnification, scale bar, 50μM. (B) CD3+/CD8+ infiltration in tumor center (intratumor) and invasion margins in the PTP4A3 negative and positive tissues. All data were manually counted of positive cells in 4 HPF in each tumor field. (C) Histogram of the CD3+ and CD8+ intratumor and invasion margins infiltrations in renal cancers. All data are mean ± SE.

