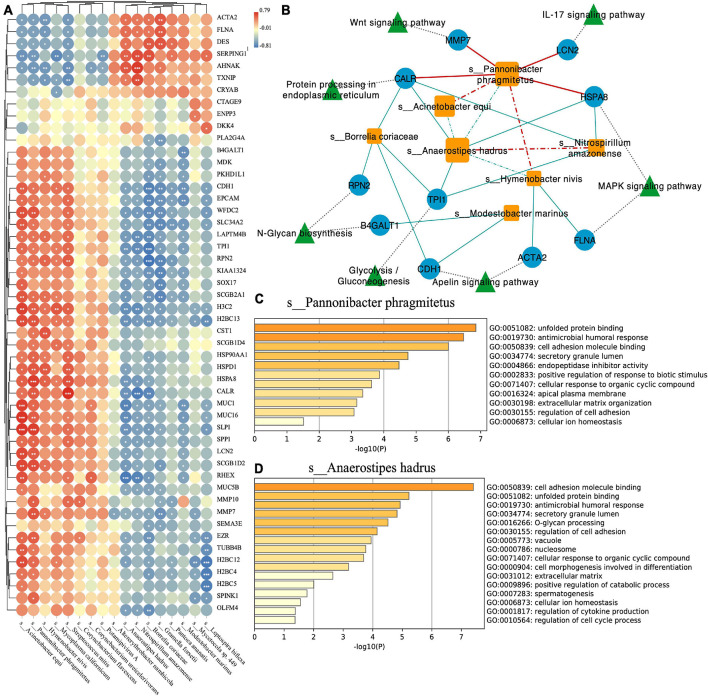
FIGURE 4.
(A) Correlation plot depicting top 50 loading genes and top 20 loading species correlations based on Spearman analysis (*** indicates p-value < 0.001, ** indicates p-value < 0.01, and * indicates p-value < 0.05). (B) Network visualizing the relationship between species, genes, and pathways. The solid line indicates the positive correlation (red) or negative (blue) relationship between the species and the gene. The dotted line indicates the positive correlation (red) or negative (blue) relationship between the species. Functional enrichment analysis of Pannonibacter phragmitetus (C) and Anaerostipes hadrus (D).

