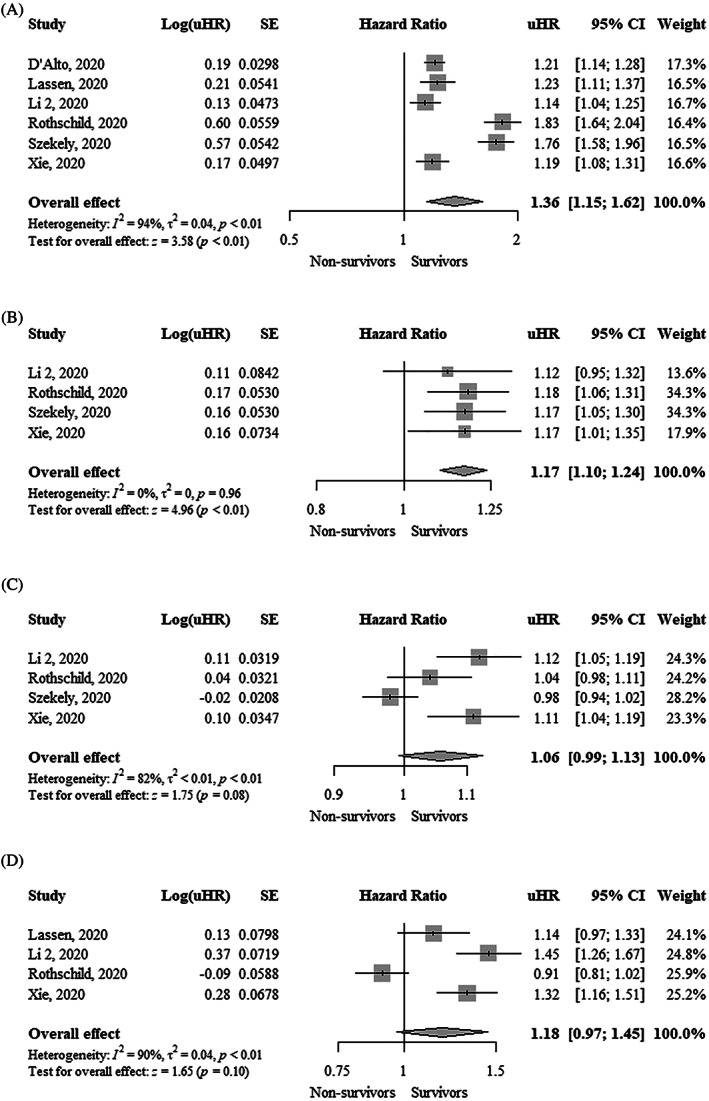
FIGURE 2.

Forest plot showing the association between one unit change in (A) Tricuspid annular plane systolic excursion (mm), (B) Tricuspid S′ peak systolic velocity (cm/s), (C) Fractional area change (%), and (D) Right ventricular free wall longitudinal strain (%) and mortality in COVID‐19 patients (unadjusted estimates). CI, confidence interval; COVID‐19, coronavirus disease 2019; uHR, unadjusted hazard ratio
