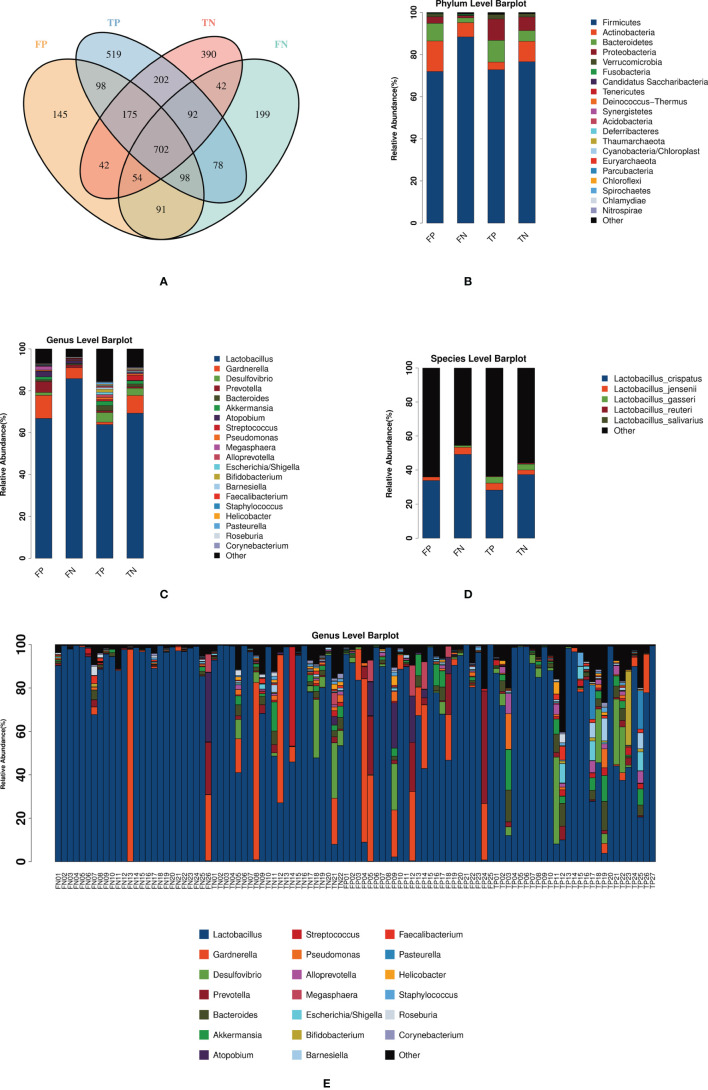
Figure 1.
Shows the distribution of the microbiota in the FP, FN, TP, and TN groups. (A) Venn diagram: represents the OTU distribution of the four groups. (B–D) The average relative abundance of the sample microbiota in four groups at the level of phylum, genus, and species. (E) The relative abundance of the 100 sample microbiota at the genus level. FN, fresh IVF-ET cycle non-pregnancy; FP, fresh IVF-ET cycle pregnancy; TN, frozen-thaw ET cycle non-pregnancy; TP, frozen-thaw ET cycle pregnancy.

