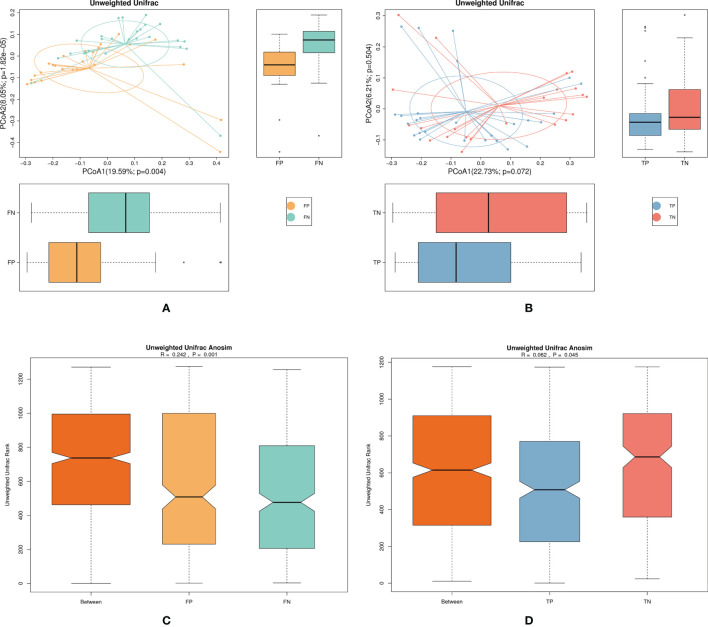
Figure 3.
Shows the β diversity of the microbiota in the pregnancy and non-pregnancy groups of the fresh and frozen-thawed cycles. (A) FP, FN group microbiota unweighted PCoA analysis chart (B) TP, TN group microbiota unweighted PCoA analysis chart (C) FP, FN group microbiota unweighted Anosim analysis chart (D) TP, TN group microbiota unweighted Anosim analysis chart. FN, fresh IVF-ET cycle non-pregnancy; FP, fresh IVF-ET cycle pregnancy; TN, frozen-thaw ET cycle non-pregnancy; TP, frozen-thaw ET cycle pregnancy, PCoA, Principal co-ordinates analysis; ANOSIM, Analysis of similarity.

