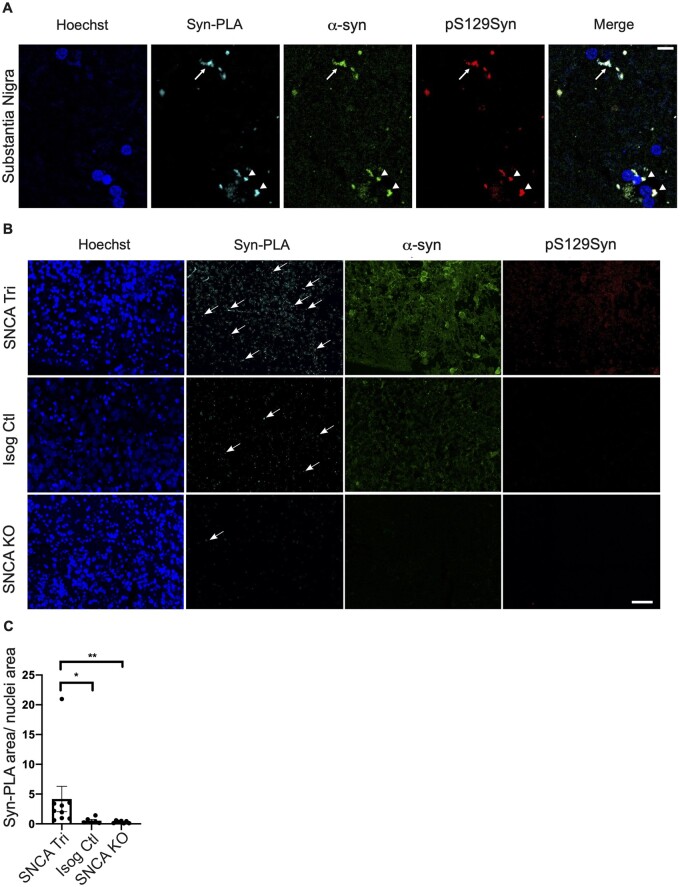
Figure 4.
Oligomeric ɑ-syn forms detected in 100-day old hMOs. (A) Syn-PLA on positive control paraffin sections, SN of patient with DLB, showing oligomeric α-syn forms (Syn-PLA), α-syn (α-syn), and pS129Syn in LNs (arrow) and LBs (triangles). (B) Syn-PLA on paraffin sections showed the highest quantity of α-syn oligomers (Syn-PLA), α-syn (ɑ-syn) and pS129Syn signal in SNCA Tri hMOs. Scale bar = 40 μm. (C) Quantification of Syn-PLA signal normalized to nuclei staining (n = 9, mean ± SEM, Kruskal–Wallis test, followed by Dunn’s multiple comparisons test, *P-value = 0.0282, **P-value = 0.0015).

