Figure 5.
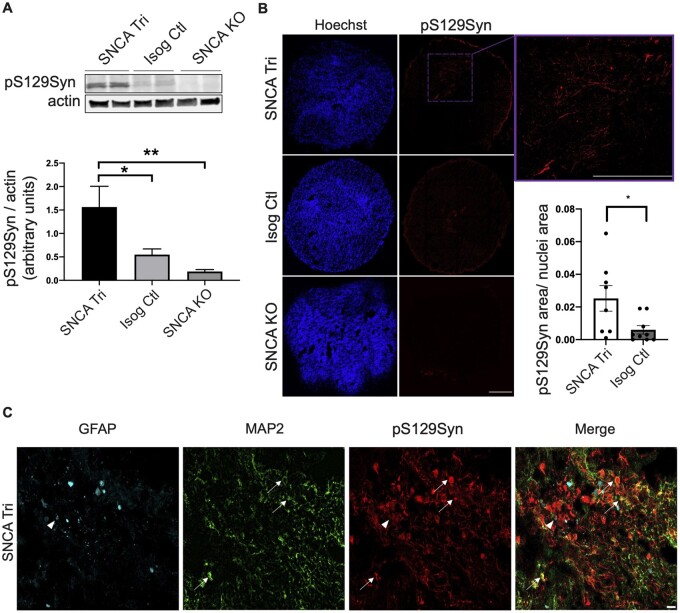
Endogenous pS129Syn observed in 100-day old hMOs. (A) Western blot analysis of pS129Syn normalized to actin in 100-day old hMOs. Quantification by densitometry (arbitrary units) (n = 16, mean ± SEM, one-way ANOVA, followed by Tukey’s multiple comparisons test, *P-value = 0.0256, **P-value = 0.0018). The corresponding uncropped blots are shown in the Supplementary material. (B) Cryosections of 100-day old hMOs stained for pS129Syn and nuclei (Hoechst). Quantification of pS129Syn staining normalized to nuclei staining (n = 8, mean ± SEM, unpaired t-test, two-tailed, *P-value = 0.0269). Scale bar = 250 μm. (C) Cryosections of 100-day old hMOs stained for pS129Syn, neurons (MAP2) and astrocytes (GFAP). Scale bar = 50 μm.

