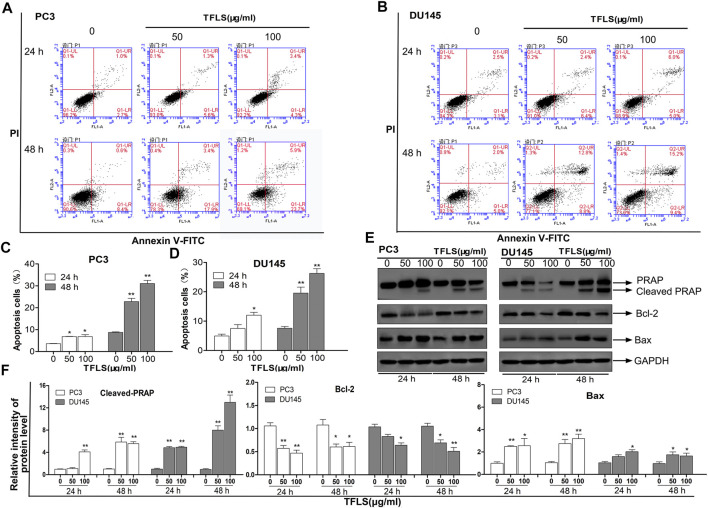
FIGURE 3.
TFLS induced apoptosis in PCa cells. PC3. (A) and DU145. (B) cells were treated with TFLS, the apoptotic cells were analyzed by Annexin V and PI double staining followed by flow cytometry analysis. The percentage of early apoptotic cells, late apoptotic cells and overall apoptotic cells were determined. Bar plot of overall apoptotic cells in PC3. (C) and DU145. (D) cells (Annexin V positive cells). (E) The expressions of apoptosis-related proteins in PC3 and DU145 cells were evaluated by Western blot. (F) Bar plots of the relative expressions of apoptosis-related proteins in PC3 and DU145 cells. Data are expressed as mean ± SEM. Compared with control group: *p < 0.05; **p < 0.01.

