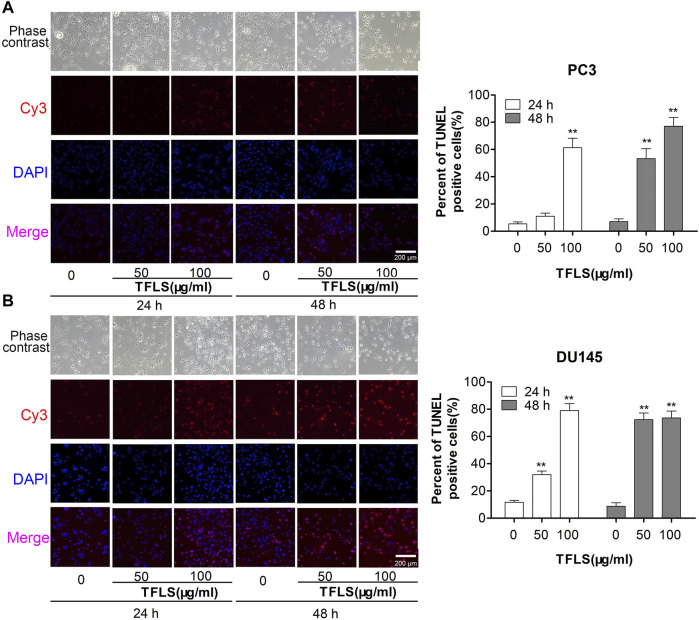
FIGURE 4.
PC3 and DU145 cells were treated with TFLS, and the apoptotic cells were detected by TUNEL assay. Representative images of apoptosis of PC3 and DU145 cells with 0, 50, 100 μg/ml of TFLS treatment for 24 or 48 h. TUNEL positive cells (red) were shown. Cell nuclei were detected by DAPI (blue). The images were obtained by a fluorescence microscope. Bar plots of the percentages of TUNEL positive cells [(A) PC3 cells; (B) DU145 cells]. Data are expressed as mean ± SEM. Compared with control group: *p < 0.05; **p < 0.01.

