FIGURE 6.
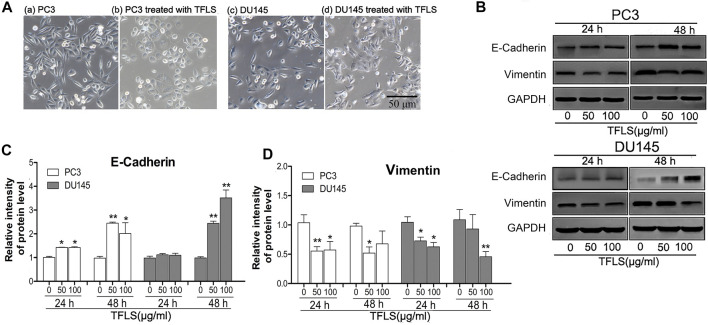
TFLS inhibited EMT in PCa cells. (A) The morphology of PC3 and DU145 cells treated with or without TFLS (100 μg/ml) for 48 h (magnification 400×). (B) The expression of EMT-related proteins in PC3 and DU145 cells with 0, 50, 100 μg/ml of TFLS treatment for 24 or 48 h; Relative expression of E-cadherin (C) and Vimentin (D) was evaluated by ImageJ and shown as bar plots. Data are expressed as mean ± SEM, compared with the control group: *p < 0.05; **p < 0.01.

