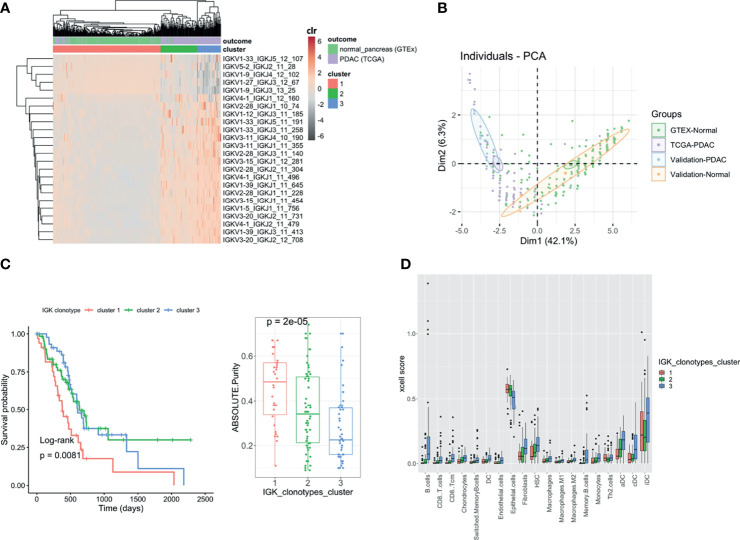
Figure 6.
Clonotype analysis. Heatmap showing the IGK clonotypes selected by CLR-LASSO to discriminate PDAC (TCGA) vs. Normal Pancreas (GTEx). The three main clusters are obtained by unsupervised cluster analysis using hierarchical clustering (A). Bi-plot showing the two first principal component analysis using the 24 clonotypes selected and applied to both discovery and validation datasets (B). Kaplan–Meier curves for overall survival with the three clusters obtained and the boxplot with the tumor purity measured using ABSOLUTE7,27 that infers the purity based on DNA somatic mutations (C). Comparison between the three clusters with the cell content deconvoluted using xCell. Those cells are the ones that show significant differences across the three clusters using Kruskal–Wallis test (FDR < 0.05) (D).

