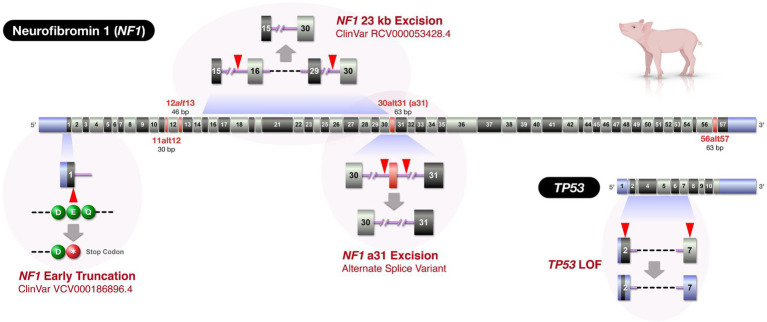
Figure 2.
Swine NF1 and TP53 gene maps and locations of genetic alterations in the novel swine models. The figure depicts three NF1 edits and a TP53 edit. Due to the large size of the NF1 gene, the figure only displays exonic regions (to relative scale) of the two genes (NF1: ENSSSCT00000019317.4 and TP53: ENSSSCT00000019534.4). Exons displayed as red indicate alternatively spliced exons homologous to those in humans. The exon numbering was based on Ensembl Sscrofa11.1, but alternatively spliced exons were added to provide congruence with previously published human NF1 nomenclature (Anastasaki et al., 2017). When intron lengths cannot be depicted to scale, double slashes are displayed. Blue exonic regions: untranslated regions. Red arrowheads: Cas9 target sites.

