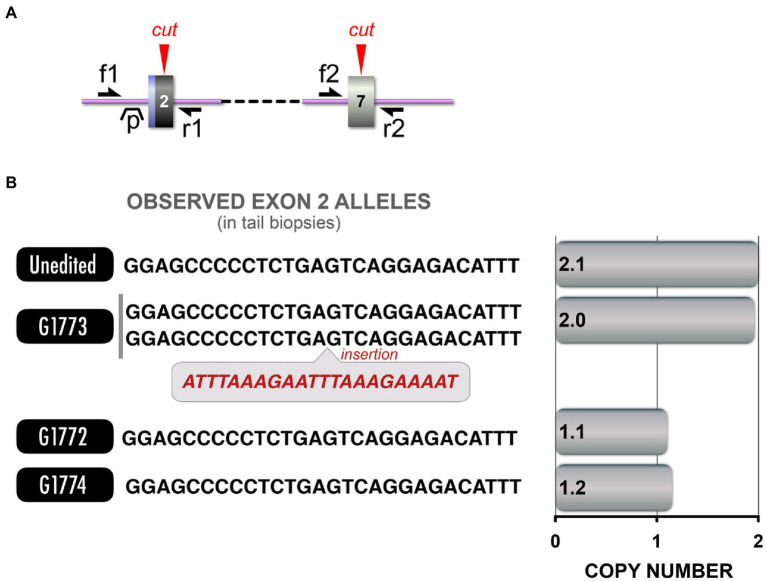
Figure 6.
TP53 LOF model and CNV analysis. (A) Schematic depicts Cas9 target sites in exon 2 and exon 7 of TP53. Red arrowheads: Cas9 cut sites, single-headed black arrows (f1, f2, r1, r2): primer annealing sites for competitive and dPCR (distinct primer sets, see Supplementary Table 2 for primer sequences), “p” indicates dPCR probe annealing site. (B) Left: Allele sequences from each pig are provided, along with the CNV analysis corresponding to those sequences. Right: CNV analysis revealed that while some pigs carried the excision, others carried alleles that could not be amplified.

