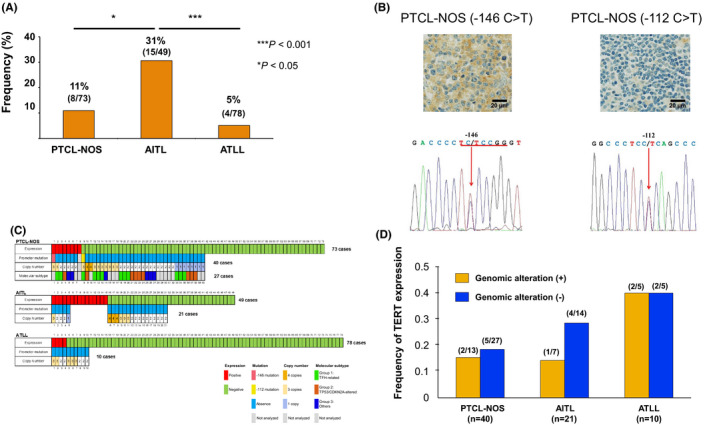
FIGURE 1.

Expression and genomic alterations of TERT in peripheral T‐cell lymphoma (PTCL). (A) Frequency of TERT protein expression in PTCL. The differences were evaluated using Fisher's exact test with Bonferroni correlation. *p < 0.05, ***p < 0.001. (B) Pathological findings and chromatograms of the TERT promoter mutation site in two PTCL‐NOS cases. Red arrow indicates a mutated nucleotide. (C) Association between TERT genomic alterations and the expression. Molecular subtypes are depicted in a part of PTCL‐NOS cases. (D) Frequency of the TERT expression based on genomic alterations in PTCL
