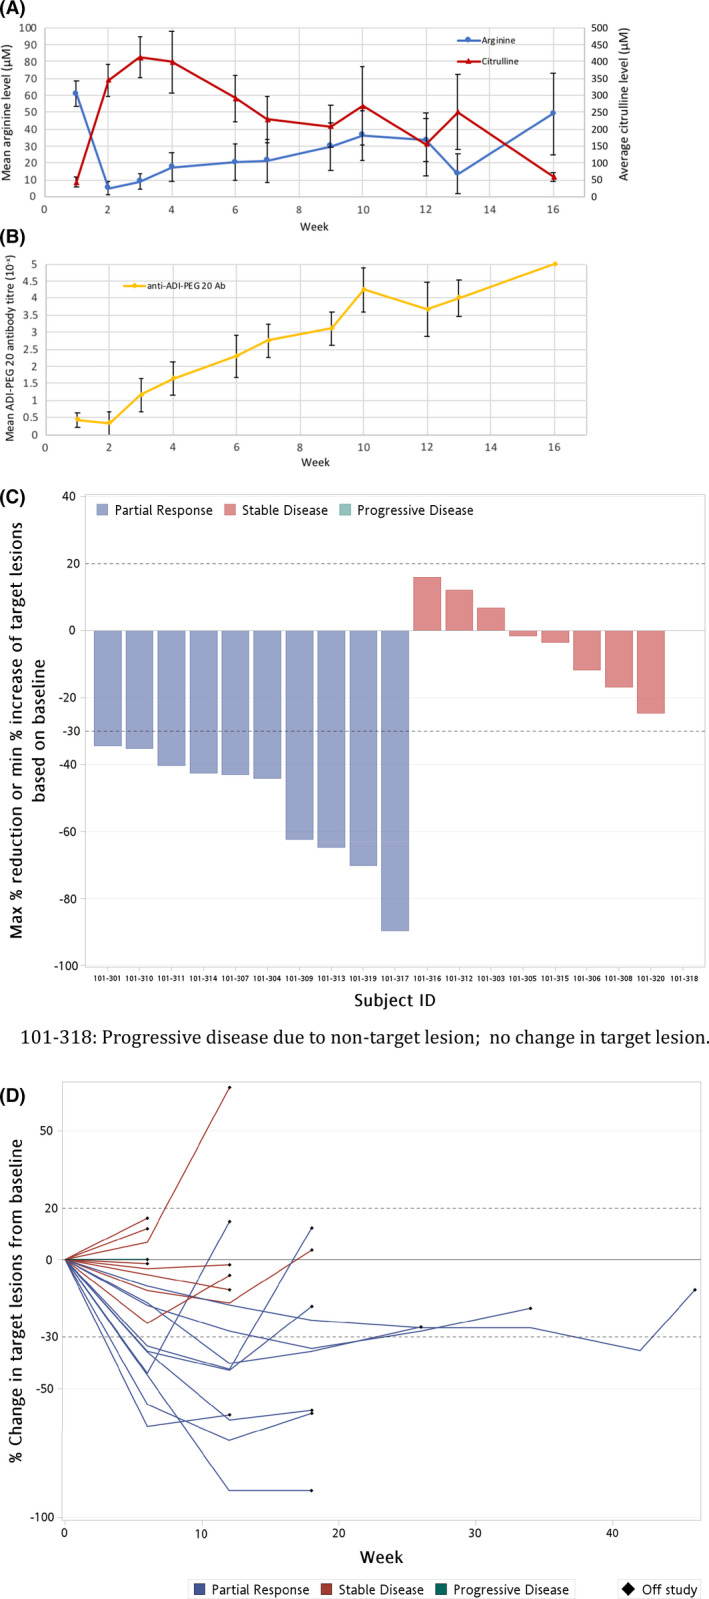
FIGURE 2.

Pharmacodynamics and response. (A) Pharmacodynamics of arginine and citrulline in patients treated with ADIPemCis. Serum [arginine] and [citrulline] are shown by week of treatment (means ± SEM). (B) Serum levels of anti‐ADI‐PEG 20 antibodies in all patients by week of ADIPemCis (Mean ± SEM); Ab, Antibody. (C) Waterfall plot of response by RECIST 1.1. to ADIPemCis. (D) Spider plots showing response duration to ADIPemCis
