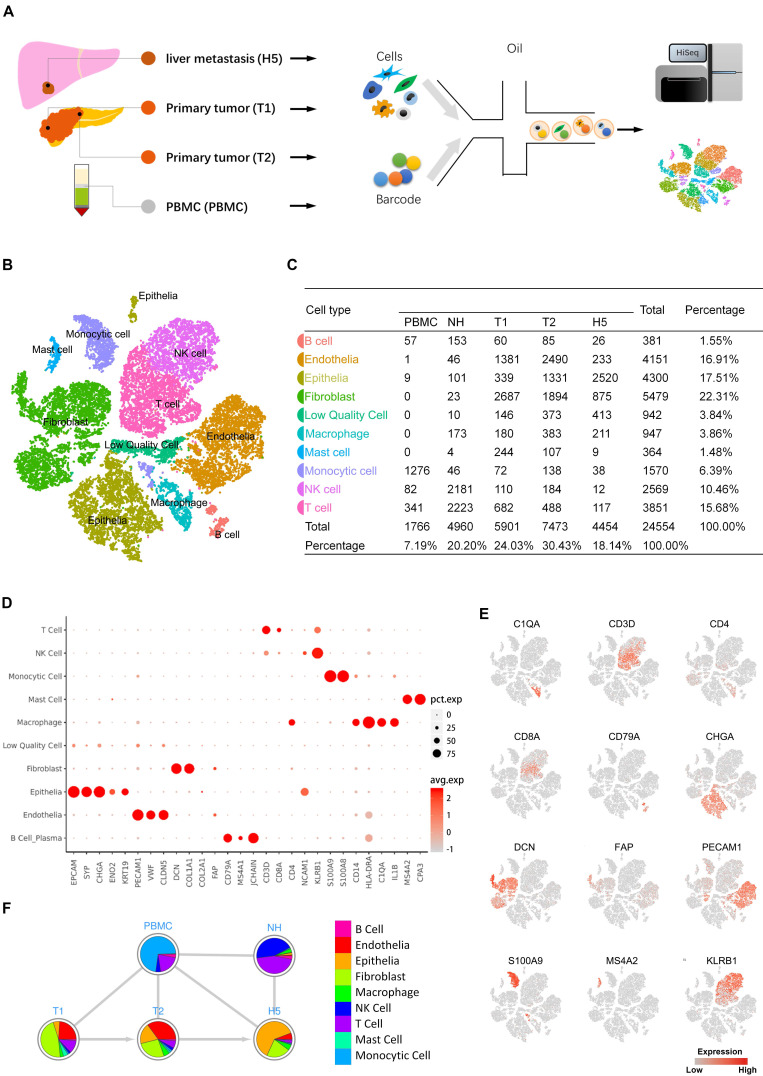
Figure 1.
A. Scheme of the overall study design. Single-cell RNA sequencing was applied to cells derived from a total of four samples (PBMC 1, primary tumor 2, metastasis 1, and normal liver tissue 1), and the output data were used for bioinformatic analyses and verification in tissue. B. The tSNE projection of 24,544 cells from 4 samples, showing the formation of 10 main clusters. Each dot corresponds to one single cell, colored according to cell cluster. C. Cell number and percentage of assigned cell types are summarized. D. Dot plot demonstrates the normalized mean expression of specific markers in each cell cluster. E. Expression levels of the indicated marker genes are projected onto the tSNE map. F. Pie charts represent the proportions of cell types in each sample source. pct.exp, percentage of cells with expression; avg.exp, average expression level.

