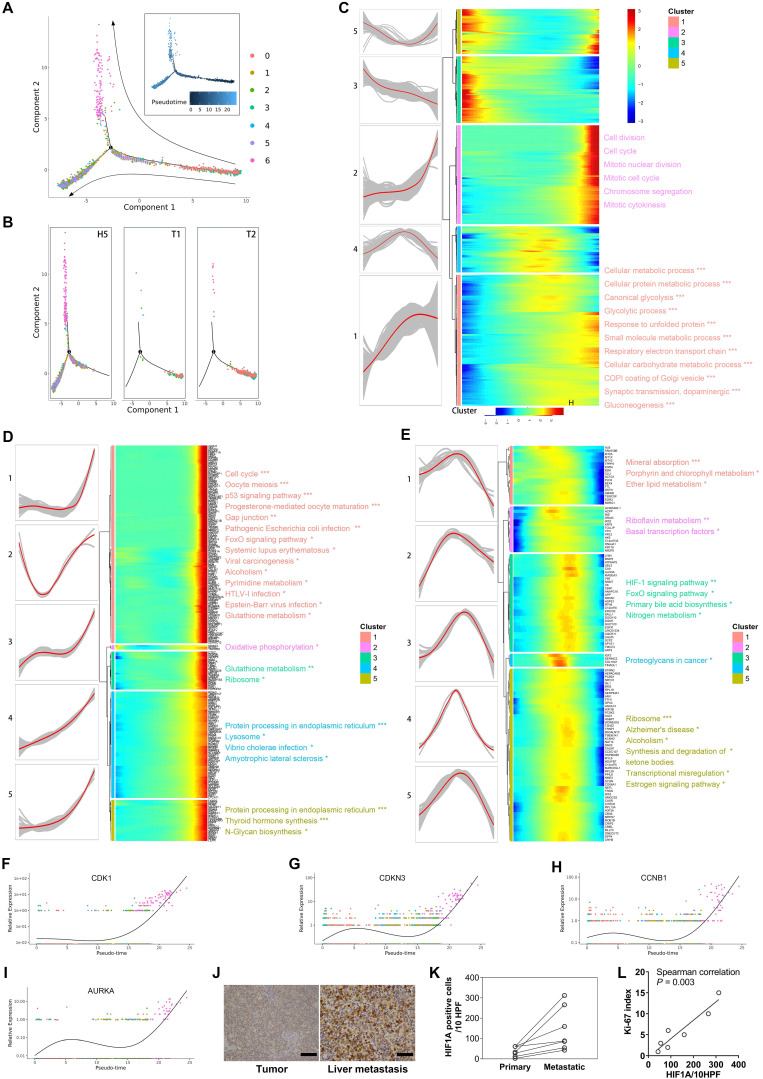
Figure 4.
A. Prediction of malignant developmental trajectory with subcluster and pseudo-time information mapped on, and each point corresponds to a single cell. B. Malignant developmental trajectories of single malignant cells for each tumor sample. Subcluster information is also shown. C. Heatmap showing expression of differentially expressed genes (rows) ordered by pseudo-time (columns). Color key from blue to red indicates pseudo-time from initiation to end. Five patterns of gene expression along the pseudo-time are displayed in the left panel. The top significantly enriched biological processes were summarized at the right of the corresponding gene cluster. *, P < 0.05; **, P < 0.01; ***, P < 0.001. D, E. The genes of patterns 2 and 4 mentioned in (C) were further clustered hierarchically. The more detailed subpatterns of pattern 2 (D) and 4 (E) were obtained. Similar to (C), the subpatterns, genes ordered by pseudo-time, and the top significantly enriched biological processes are shown. F-I. The relative expression of cell-cycle related genes in each malignant subcluster along the pseudo-time are plotted. J. Representative IHC images of HIF1A protein expression in primary site and liver metastatic site are shown. K. The dot-line plot shows the change in the number of HIF1A positive cells per high-power field (HPF) between paired primary and liver metastatic lesions. L. Correlation between the number of HIF1A-positive cells per HPF and Ki-67 index in seven liver metastatic lesions was estimated by Spearman's correlation analysis.

