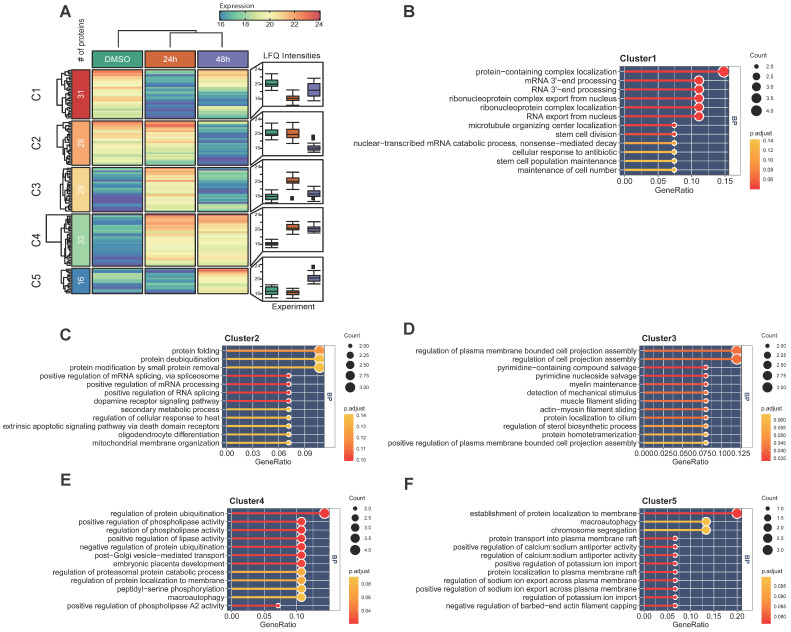
Figure 7.
Quantitative proteomic analysis of MELK-8a treated Hela cells. A. Heatmap of differentially expressed proteins between three groups. Proteins were grouped into 5 clusters using the k-means algorithm. Box plot was used to visualize the distribution of LFQ intensities for each group. B-F. GO enrichment analysis for each group of differentially expressed proteins.

