Figure 4.
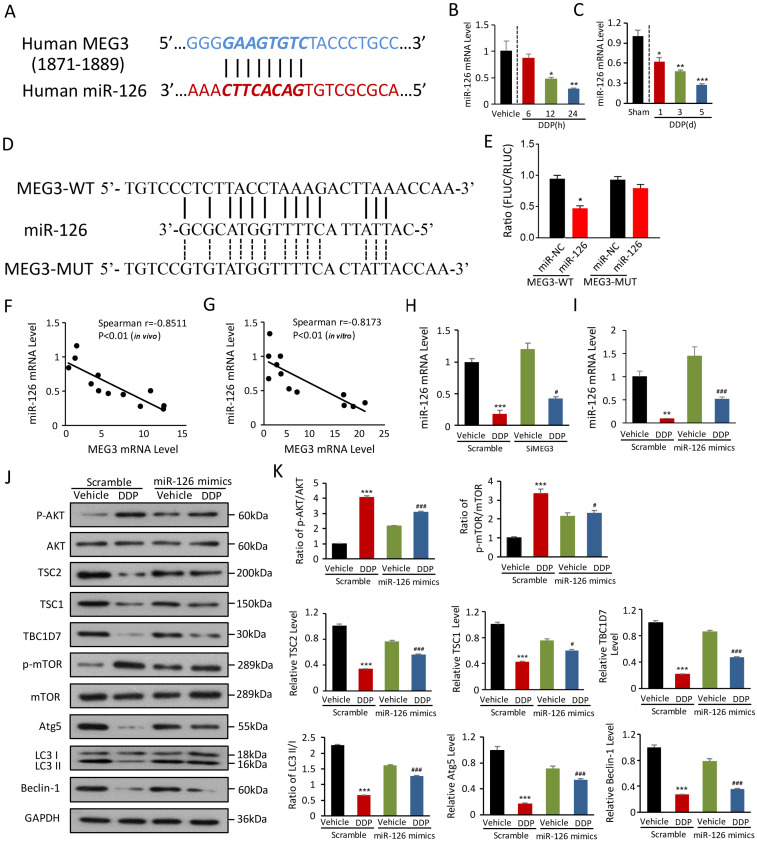
miRNA-126 is negatively regulated by lnc-MEG3 and ablates DDP-induced autophagy depression. (A) The targeting relationship between lncRNA MEG3 and miRNA-126. Relative mRNA level of miRNA-126 in HK-2 cells (B) and the kidney of DDPIN mice (C). The luciferase activity in the MEG3-WT and MEG3-MUT compared to control group, and the elements responsible for miR126 expression are between -1871 and -1889 as shown in (D) and (E). Negative correlation between lnc-MEG3 and miRNA-126 in vivo (F) and in vitro (G). Relative mRNA level of miRNA-126 under the condition of lnc-MEG3 silencing or miRNA-126 mimics in DDP-treated HK-2 cells, respectively (H and I). (J and K) Western blot analysis of p-AKT, AKT, TSC2, TSC1, TBC1D7, p-mTOR, mTOR, Atg5, Beclin-1 and LC3 in the DDP-treated and/or miRNA-126 mimics HK-2 cells. *P < 0.05, **P < 0.01, ***P < 0.001 versus control, #P < 0.05, ##P < 0.01, ###P < 0.001 versus DDP-treated control (n=3).

