Figure 4.
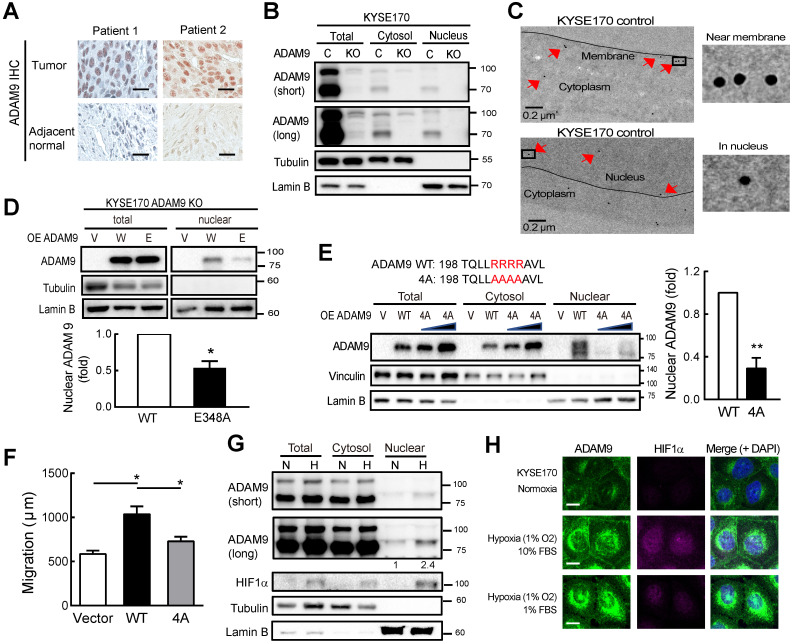
ADAM9 protein is detected in the nuclei of ESCC cells. (A) Representative image of ADAM9 IHC staining in tumor and adjacent normal tissue in ESCC specimens. Scale bar, 25 μm. (B) Nuclear localization of ADAM9 in control and ADAM9 KO KYSE170 cells. C, control; KO, ADAM9 KO. Short or long, short or long exposure. (C) Presence of ADAM9 in cell membrane and nucleus of KYSE170 cells using transmission electron microscopy. ADAM9 is detected using 15 nm gold particles. Arrows indicate the positive signals for ADAM9 detection (top). The highlighted square areas are shown (right). (D) Cellular fractionation followed by western blot analysis in ADAM9 KO KYSE170 cells transiently transfected with plasmids of ADAM9. W, wild type and E, E348A mutant. Representative images of total proteins and nuclear proteins using the same antibody staining from the same blots. Nuclear ADAM9 protein levels were calculated from three independent assays. (E) Western blot analysis in ADAM9 KO KYSE170 cells transiently transfected with plasmids of ADAM9 WT and 4A mutant. One and two-fold of plasmid amount of ADAM9 4A mutant were used. Nuclear ADAM9 protein levels were calculated from three independent assays. (F) Migration ability of ADAM9 KO KYSE170 cells transiently transfected with plasmids of ADAM9 WT and 4A mutant. (G) Western blot analysis of KYSE170 cells treated with normoxic or hypoxic conditions. The amount of ADAM9 protein relative to the normoxia group was shown. (H) Fluorescence immunohistochemistry of ADAM9 and HIF1α in KYSE170 cells with confocal microscopy. Hypoxia, 1% O2. Scale bars, 20 µm.

