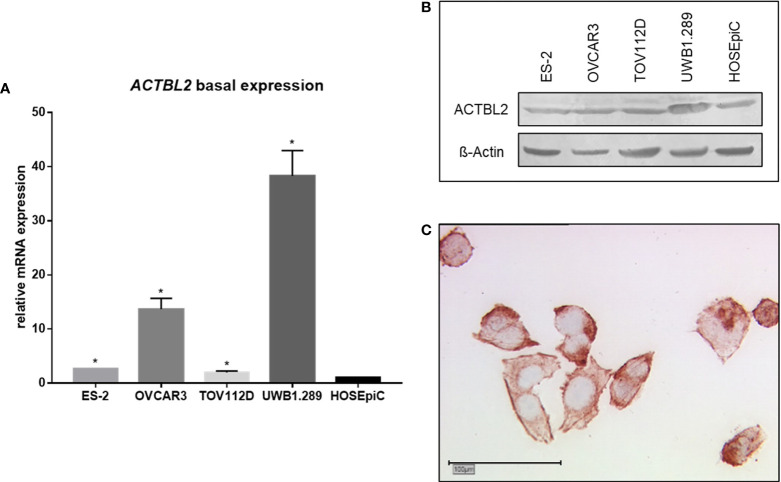
Figure 2.
Basal expression of ACTBL2 in ovarian cancer cell lines. (A) qPCR results showing ACTBL2 expression in four EOC cell lines (ES-2, OVCAR3, TOV112D, UWB1.289) compared to the benign control cell line (HOSEpiC; n=6; *p=0.028). (B) Exemplary Western blot analysis of ACTBL2 expression (42 kD) in four EOC cell lines (ES-2, OVCAR3, TOV112D, UWB1.289) compared to the benign control cell line (HOSEpiC). (C) Detection of ACTBL2 in UWB1.289 cells by immunocytochemistry. Exemplary photographs (25x magnification; scale bar=100µm) showing protein expression in both cytoplasm and cell membrane.

