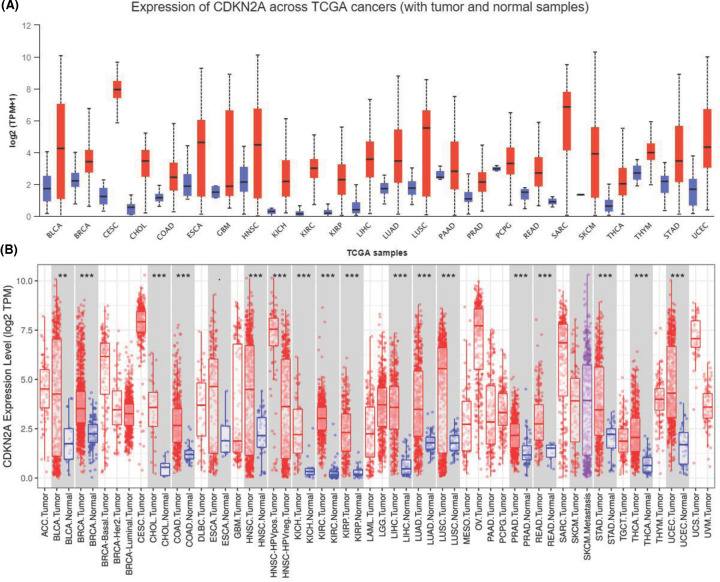
Figure 1. The mRNA expression of CDKN2A in various normal tissues and tumors.
(A) Increased or decreased expression of CDKN2A in different cancer tissues, compared with normal tissues in TCGA databases (Data Release 27.0 - October 29, 2020). (B) CDKN2A is differentially expressed between tumor and normal tissues in some cancers from TCGA and GEO databases. Each boxplot represents CDKN2A expression [RNA-seq RSEM, log2(normalized count +1)] across different cancers. Red is for tumors and blue is for normal tissues. The gray box shows that the expression of CDKN2A in liver cancer tissues is significantly higher than that in adjacent normal tissues. P-value significant codes: 0 ≤ *** < 0.001 ≤ ** < 0.01 ≤ * < 0.05 ≤ · < 0.1.

