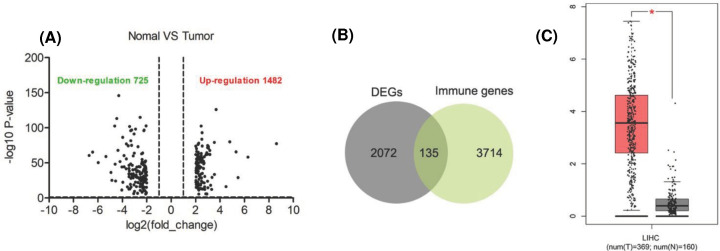
Figure 3. Procedure for the selection and validation of the prognosis biomarkers in hepatocellular carcinoma.
(A) Volcano plot of changes in gene expression in normal and tumor tissue. The latest data release of TCGA (Data Release 27.0 - October 29, 2020). Plots are the crosses of P values on the y axes and the ratio of gene expression on the x axes. The cutoff criteria (|log fold change| ≥ 1; P≤0.05) are indicated. (B) Venn diagram comparing DEGs in normal and tumor tissue with immune genes. Overlapping numbers represent the number of mutual genes between treatments. (C) The expression levels of CDKN2A members in GEO dataset. P-value significant code: *, P<0.05.

