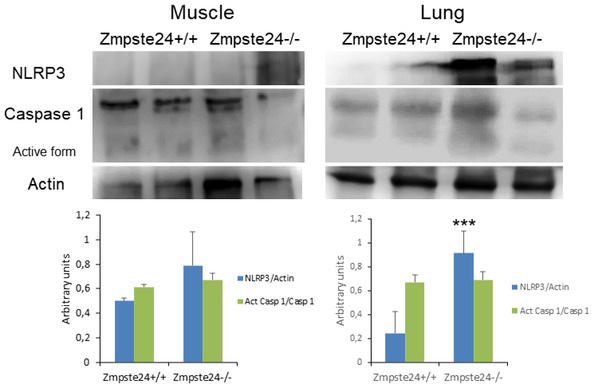
Figure EV1. NLRP3 inflammasomes expression in lung and muscle from progeroid animals.

Western blot analysis with representative blot including NLRP3, caspase 1, and actin levels in lung and muscle tissues from wild‐type and Zmpste24−/− mice. Densitometric analysis is shown as means ± SD, n = 5 mice per group. Data are shown as means ± SD. ***P < 0.001, wild‐type vs Zmpste24−/− mice. One‐way ANOVA test was used for statistical analysis.
Source data are available online for this figure.
