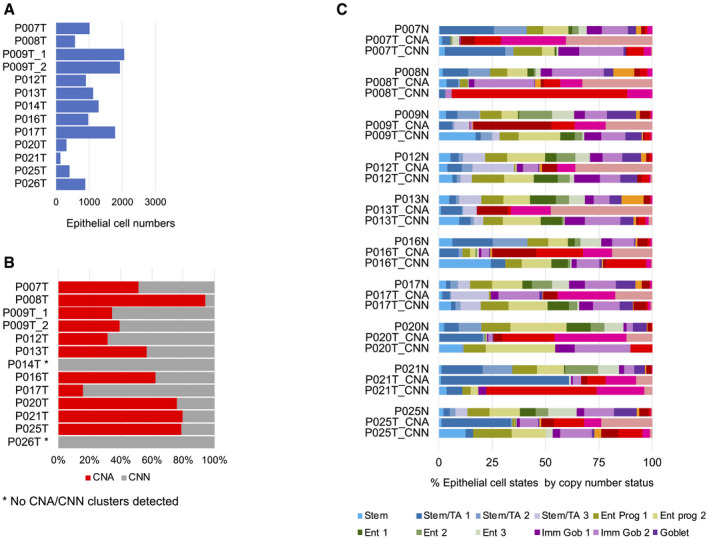
Figure EV2. Cell type census, per patient.

- Epithelial cell numbers per tumor sample retrieved by our analysis pipeline.
- Copy number calling on tumor samples. No copy number clusters could be called for P014T and P026T (see also Fig EV1A).
- Relative prevalence of cell differentiation states in the epithelial compartment, per patient. Cell state prevalence from tumor samples is given for copy number‐aberrant (CNA) versus copy number normal (CNN) cells.
