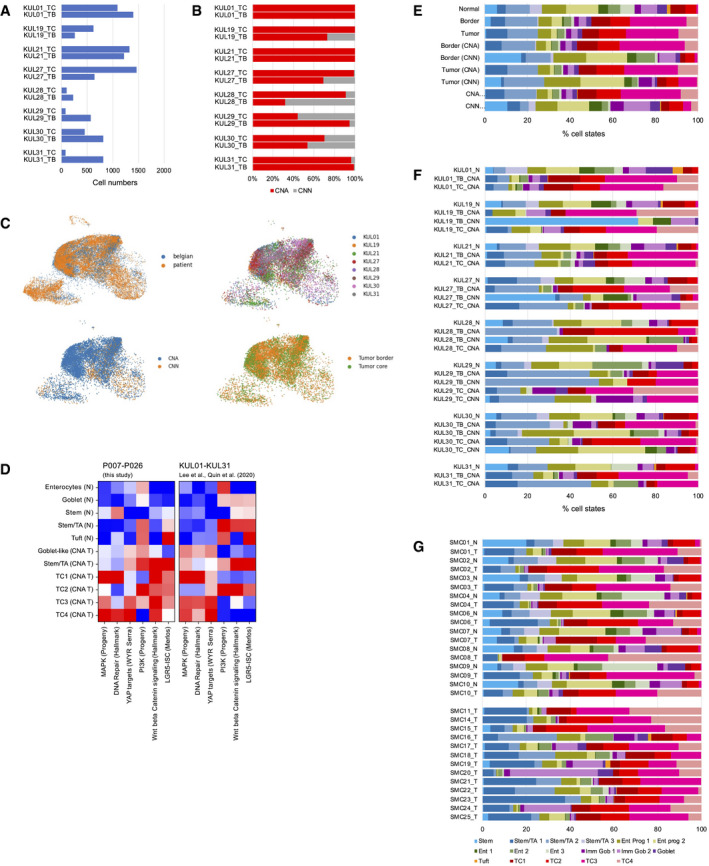
Analysis of the KUL01‐KUL31 cohort (Lee
et al,
2020; Qian
et al,
2020). (A) Epithelial cell numbers per sample retrieved by our analysis pipeline. (B) Copy number calling on tumor border (TB) and tumor center (TC) samples. (C) Distribution of KUL01‐KUM31 transcriptomes on the reference UMAP. Top left: blue: KUL01‐KUL31 transcriptomes. Orange: Transcriptomes from P007‐P026 samples; top right: Distribution of KUL01‐KUM31 transcriptomes, by patient; bottom left: distribution of copy number normal versus aberrant transcriptomes; bottom right: distribution of tumor border versus tumor center transcriptomes. (D) Signature strengths of transcriptome clusters from our study (P007‐P026), compared to KUL01‐KUL31 transcriptome clusters after imputation. (E) Cell state distribution in the KUL01‐KUL31 cohort, by category. (F) Cell state distribution in the KUL01‐KUL31 cohort, by sample.

