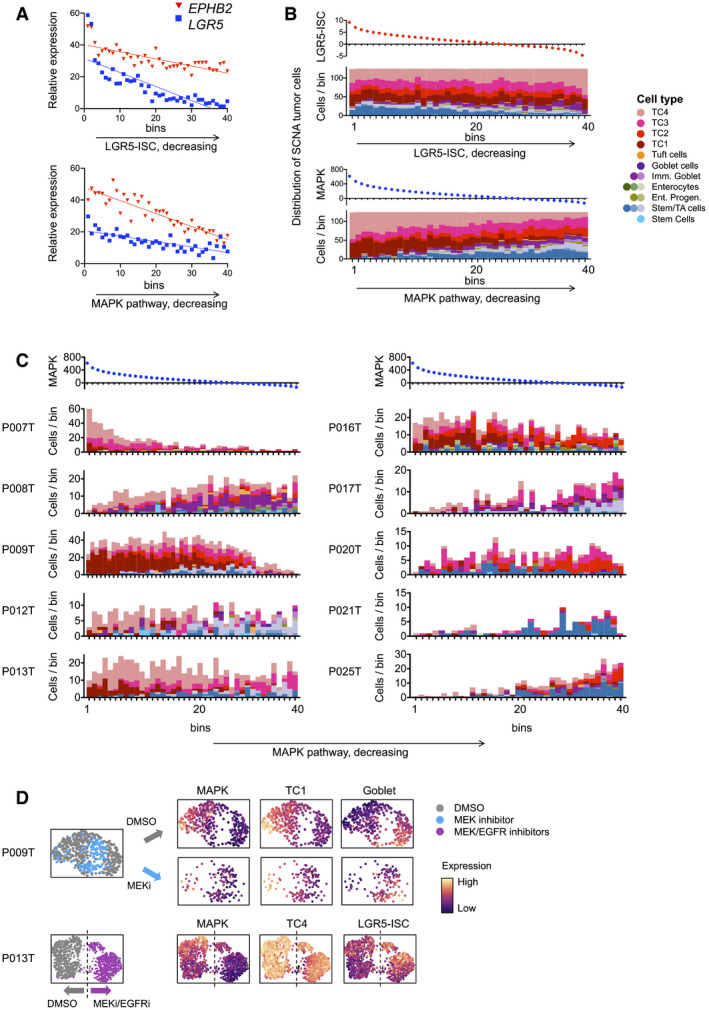
Figure 4. MAPK activity is linked to CRC cell differentiation states.

- Gene expression of LGR5 and EPHB2, along activity gradients of LGR5‐ISC or MAPK target gene signatures.
- Cell state distribution of SCN‐aberrant CRC cells along gradients of LGR5‐ISC or MAPK transcriptional signatures, as in A.
- UMAP representations of single‐cell transcriptomes derived from P009T or P013T organoids, after MAPK blockade using MEK or combined MEK and EGFR inhibition. Color codes are treatment conditions or expression strength of signature, as indicated. Dashed line in P013T UMAP roughly separates control (DMSO) and MEK/EGFR inhibitor‐treated cells.
