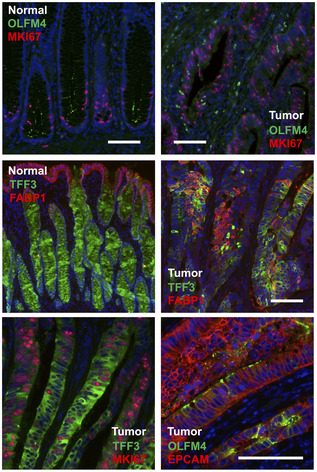
Figure EV4. Assessment of CRC cell heterogeneity by immunofluorescence.

Immunofluorescence analysis for OLFM4, MKI67, FABP1, and TFF3 in normal and tumor tissue. All sections are from patient P009, except the EPCAM/OLFM4 co‐staining that was done on tumor tissue of P016. Scale bars indicate 100 µm. For marker expression in UMAP space, see Appendix Fig S3.
